Thursday, April 23, 2020

2020 hurricane outlook update


I released my thoughts on the upcoming Atlantic Basin hurricane season on March 23.  Today is the 23rd of April. So, I wanted to post an update.

The 2020 Atlantic hurricane season starts on June 1st.  This point in April is a good time to take another look at the key factors, in order to get a better handle on what conditions will be like during the hurricane season.  I will likely post a final update on this year’s hurricane season on May 23rd.

The predictions from other outlets:

Major weather outlets and universities release hurricane outlooks. Here are the major ones that gather interest.
 
Colorado State University has a prediction of 16 named storms, 8 hurricanes, 4 major hurricanes, with at least one major hurricane making a landfall on the U.S. coastline.

The Weather Channel is predicting 18 named storms, 9 hurricanes, 4 of them becoming major hurricanes.

AccuWeather is predicting 14-18 named storms,7-9 hurricanes, with 2-4 becoming major. They think 2-4 storms could impact the U.S. Coast.

WeatherBELL is predicting 14-20 named storms, 7-11 hurricanes, 3-6 of them major. They also believe the Gulf Coast and East Coast are at a high risk for landfalling tropical systems.

Tropical Storm Risk (TSR) is predicting 15 named storms, 7 hurricanes, and 4 major hurricanes.

University of Arizona is calling for 19 named storms,10 hurricanes, 5 major hurricanes.

North Carolina University is calling for 18-22 named storms, 8-11 hurricanes, and 3-5 major hurricanes.
 
There are two other outlets that I like to look at.  The one from Huston’s Weather Research Center isn’t out yet, or I haven’t been able to find it if it is out. The other is NOAA itself, but they don’t release an outlook until the end of May.

Climate Signals:


Here is a look at the current Sea Surface Temperature (SST) anomalies, as well as SST from past seasons, and precipitation rate patterns for August through October.

The North Atlantic


When we look back at Atlantic Basin hyperactive seasons, we see a similar SST pattern in the Atlantic.

The Gulf of Mexico and Caribbean


The SST’s across the Caribbean and Gulf of Mexico are warmer than average.
Here is a look at the SST anomalies in the Gulf. The Gulf is playing a big part in the highly active severe pattern in April. Those warm waters are going to be a big concern during the hurricane season. One thing to keep in mind, is many times cool springs, lead to early season tropical activity. not saying it will happen, only something to keep in the back of your head.

The Pacific Ocean


The SST anomalies across the Pacific are warm.

ENSO


Earlier this April we had borderline weak El Nino Modoki conditions in place. Since then we have transitioned to neutral conditions. The Indian Ocean Dipole is also neutral. We most likely will stay in neutral territory for the next few months. But, as we get into July and especially August, we very well could be in a weak La Nina, that extends into the late fall.

Madden Julian Oscillation (MJO)


Looking at the subsurface tropical Pacific SST, we see there is a shallow layer of warm water near/at the surface, with a cooler pool of water under it. The warm surface water was west of the Dateline, but now it has shifted near to and a little east of the Dateline.


So far, the analog years I’m using are: 1933, 1952, 1953, 1959, 1995, 1996, 1998, 2005, 2007, and 2017. Most of these seasons saw above average tropical activity in the Atlantic Basin. In fact, many of these seasons ended up being hyperactive. 

When we look back at past years that were active and compare that to the SST anomalies, I’m using for analogs We see the SST pattern is quite similar.


2005 and 2017 were very hyperactive 2017 had 17 named storms and 2005 ended up with 28 named storms.  When we compare SST from those two hyperactive seasons to now, we see very similar SST patterns. In fact, currently the Atlantic main development zone, Gulf, and along the East Coast are warmer than they were in 2005. Something to at least think about.


During November wind anomalies were westerly in the Pacific. From mid-December into mid-March the trade wind anomalies were generally easterly. Then from the end of March to now the wind anomalies have switched to become westerly in the Central Pacific.  This has to do with the MJO and SOI.

In the last two months, negative subsurface temperature anomalies, have extended from the western to eastern Pacific Ocean.

Positive subsurface temperature anomalies reside near the surface, except in the eastern Pacific (100 W-80 W).

Here is the current SOI index numbers and chart.
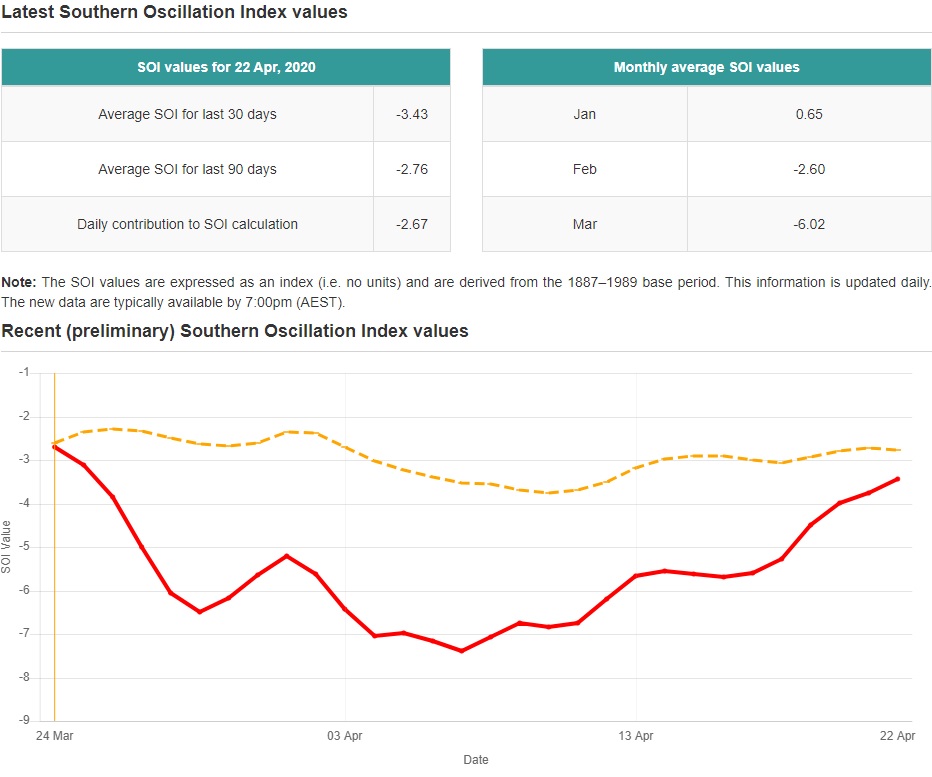


Once the SOI goes positive the easterly trade winds will increase leading to those cooler subsurface SST to upwell to the surface.

If the MJO keeps rotating through phases 2 and 3 this Summer, that would help promote tropical activity in the Atlantic Basin.

Accumulated Cyclone Energy (ACE):

Ace is used to measure the intensity of a hurricane season as well as individual   tropical cyclones. The higher the number the more active the season and the danger level during the season and the greater the damage potential of individual storms.

The ACE statistics go back to 1851. Many of my analog years saw higher than average ACE. 1933 holds the record for the highest ACE; that being 259. 2005 wasn’t too far behind with an ACE of 250. 2017 ranks 7th, with an ACE of 223.

An ACE value of 95-105 is considered average in the Atlantic Basin. For this season I'm calling for an ACE well above that.  

Where are my thoughts?

I am forecasting an above average hurricane season due to a combination of either neutral ENSO conditions or La Nina conditions, an active Western African Monsoon, well above average SST and the possibility of lower than average wind shear conditions. The things I’ve just gone over, shows there is a real possibility of a well above average season with close in activity being a real danger this season. This is something that will need to be watched closely.

I still feel there is a high risk for tropical cyclone impacts for places like Cuba, Hispaniola, Bahamas, the East and Gulf Coast. When we look back at the precipitation pattern from those analog and high impact years, we see the pattern is very wet in the Gulf and along the East Coast.  That supports my thoughts on there being a real risk for Coastal areas of the U.S.

I haven’t changed my numbers I released a month ago. You can find them here.


Thanks for reading.


Wednesday, April 1, 2020

The 2020 tornado season thoughts.


Well it’s April 1st, which means severe season for us in the Northeast will be here soon. It’s already gotten off to a fast start across the Plains, Southern States into the Midwest; these areas have seen several cluster outbreaks of tornadoes over the last few weeks. Not only has the early spring been active, but the winter was active as well.  January and February saw several severe outbreaks, especially in the south and southeast, that brought increased tornado activity; even Maryland saw a record breaking five tornadoes on February 8th.

Springtime and tornadoes

April is considered the start of the most dangerous three months for tornado activity across the CONUS. The reason tornadoes are more common in the spring is because conditions that lead to tornadogenesis come together more frequently during the spring.  Tornadoes are most likely to form, when the northern jet stream dips south into the CONUS. The trough brings cold dry into direct contact with warm moist air provided by the Gulf of Mexico. Tornadoes need four ingredients: lift, windshear, moisture, and instability. That dip in the jet stream helps provide for the windshear. The colder dry air is pushed over the top of the warm moist air; this creates instability, with the warm air rising up through the colder air aloft causing updraft. If things combine just right, a tornado can form. These conditions are more commonly found in the spring of the year. 


What is considered tornado season in the Northeast and northern Mid-Atlantic?

Severe/tornado season for New York State, New England, and Delaware, is generally June through August. While Pennsylvania and Maryland are generally May through July. But our peak time is usually end of May into the first part of July.   But we have to remember tornadoes can occur any month of the year, if conditions are favorable.

Tornadoes can also happen at any time of the day or night, But the most likely time for tornadoes to occur are during the afternoon into the evening, 3 P.M. to 9 P.M.

The US averages 1,239 tornadoes every year, based on the 20-year average from 1998 to 2017. Almost 60% of these occurred over that April through June time-frame.

For more information on the New SPC Convective Outlook, click here.

For more information on thunderstorms and tornadoes, click here   

For more information on tornadoes, click here

For more information on non tornadic severe weather, click here.

This seasons pattern:

Last year was  a very active tornado year, second only to 2011. 2011 was extremely active with nearly 1700 recorded tornadoes. Last year saw 1,422 tornadoes, based on the SPC inflation adjusted count. The question is what about 2020?

As I said above, winter 2019-2020 was quite active severe wise. The same pattern that brought the warm winter, is also likely to bring an active spring severe season.

Models are nowhere near sophisticated enough to use for tornado forecasting. So we have to use statistical methods instead.

Studies have shown tornado occurrence is linked to pressure anomalies near the Rocky Mountains, dry lines, the North American low-level Jet, the Madden-Julian Oscillation, the El Nino Southern Oscillation, North Atlantic Oscillation, and Sea Surface Temperature Anomalies SSTA in the Gulf of Mexico (GOM).  There is a strong linkage between SSTA in March and April, emergence of the PNA, and year to year tornado activity.  These teleconnections are what control the troughing/ridging placement, Jet Stream Position, and moisture laden flow from the GOM.

SST Map is from WeatherBell

Over the winter we had a very persistent positive Arctic Oscillation (AO) and positive North Atlantic Oscillation (NAO).  Those who follow my post, know this keeps most of the cold air and the active storm track locked up in Canada and Arctic. The resulting jet stream cutting through the CONUS helped the warmer southern air to surge northward. Add in the negative Pacific North American Pattern and the mainly positive Eastern and Western Pacific Oscillations and you have the reason winter 2019-2020 was so warm.


Given that the same pattern we had during the winter is still with us. The likelihood it will extend through this Spring and into Summer 2020 is quite high. So, the same pattern that caused the strong and active southeast ridge, is also going to have a big impact on our spring into summer severe weather possibilities. By and large the overall teleconnection pattern during December into March is still with us.   So, it seems reasonable to assume that we will see the jet bring storm systems farther south, bring cold dry air into contact with the warm moist are out of the GOM due to the southeast ridge. Given the pattern, an above average tornado season is likely in 2020. April could end up with a lot of severe weather including tornadoes.  The increased threat for severe weather will continue to ramp up for May and June. But while the overall pattern looks quite favorable for tornado production. That doesn’t guarantee that it will actually end up producing more tornadoes.

What about the Northeast and northern Mid Atlantic?
Pennsylvania, the Mid Atlantic into the Northeast saw above average activity in 2019. New York State and New England have seen an uptick in severe weather over the last few years.  This is in part due to the warmer SSTA off the coast. On my Facebook weather page, I mentioned that the SSTA in the GOM and along the Eastern Seaboard are 3-6 weeks ahead of schedule.  During March we saw how severe weather overachieved in terms of the severity of the setup. The reason for that is likely the very warm SSTAs. So, with all of this in mind, I think the Mid Atlantic and Northeast will see an above average severe year. But severe thunderstorms produce more than just tornadoes, so regardless of how many tornadoes we end up with, there will be an increased risk for large hail, flooding downpours, damaging wind gust and downburst.

Trying to forecast tornadoes is very difficult, trying to forecast tornado development weeks and months ahead of time is virtually impossible. So, all I can do is show the overall setup that looks to be in place and try to draw some conclusions from similar setups. There is no way I can tell where or when tornadoes will form, how many outbreaks we will see, or how strong the tornadoes will be.  So instead, make sure you have a severe weather plan in place. Practice that plain with your family, so everyone knows where to take shelter and what to do to try and be safe. By doing this you’ve taken a major step in assuring your family has a safe severe weather season.  Always obey warning issued by the NWS. Also buy a NOAA weather alert radio. 

For more information on severe weather safety, click here.  

Well that is it…..