
The Days
have been getting shorter and the temperatures have been getting colder. This
time of year, many of y’all, want me to look into my crystal-ball, and try to
give you a leg up on what might happen this winter.
Please keep
in mind, longer-range seasonal predictions often involve the broader picture of
what’s to come. Outlooks like this cover the overall region. And don’t go into
local detail, for individual in your back yard snowfall amounts. As we see
every winter snowfall extent and amounts can vary greatly, over relatively
short distances.
This outlook
will be more in plain speak. Details on what teleconnections are and what they
mean, can be found in part two.
The signals
I use to try and figure out how things will be this winter are very mixed. So
that is telling me this winter is going to see a lot of variability.
If you don’t
want to read through the entire outlook, you can skip to the bottom to the conclusion.
But you will miss the reasons I decided on the end result.
Over the
course of this three-part outlook, I’ve been talking about analogs. Here is the
list of analog seasons that I’ve settled on.


Teleconnections:

La Nina…
During La Nina,
we typically see the jet stream come out of Western Canada, dip across the
Upper Midwest that then move somewhere over the Ohio Valley and then into the
Northeast. On average temperatures are
warmer near the jet stream and south of it.
The Northeast pattern tends to be active.
This is a double dip La Nina, meaning this is
the 2nd year in a row for La Nina. 2nd
year La Ninas tend to be weaker than 1st year ones.
Some weather
outlets are calling for an east based La Nina this winter, others are calling
for a general Pacific Basin wide La Nina. The type of La Nina is important, as
these variations can make for much different winter outcomes. Everything I’ve
been looking at, has me thinking this is going to end up being a La Nina Modoki
(hybrid La Nina) When we look at the subsurface temperature anomalies,
subsurface temperatures are very cool, and look to be more west based. La Nina
Modoki events are very rare, even rarer than El Nino Modoki. We had a La Nina
Modoki in 1989. The winter of 2010-2011 was another La Nina Modoki.
If this does
become a La Nina Modoki, it would tend to have the storm track a little farther
north than when we see an east based La Nina. This would setup the Northern Mid Atlantic
region as the battle zone. This would mean the Northern Mid Atlantic and those
close to it, would see a roller coaster of temperatures fluctuations that could
vary from week to week. This could have large implications was to precipitation
types during the winter.
We also see
a lot of variability when it comes to La Nina, especially 2nd year La Ninas. 2011-2012 was a second year La Nina, that
winter was dismal with warm temperatures and well below average snowfall. But 2000-2001 was a second year La Nina that
was the opposite. So, while La Nina can
be a big driver, we have to look beyond the ENSO.
Southern
Oscillation Index…
I’ve been
talking about the pattern change for quite some time. One of the teleconnections
I watch, is the Southern Oscillation Index (SOI). When we see big changes in
the SOI it can affect the North American pattern two to three weeks down the
road. Looking at the chart we can see the SOI take a nose dive a little before
Halloween. This is strongly connected to the very cold pattern setting up for
this weekend into the rest of November.
Strong La Nina have SOI 30-day values up around the upper 20’s into the 30’s. The last moderate La Nina had the mid-teens to mid-20’s. So far this La Nina is barely making it into the 11’s. So right now, this is quite weak. There isn’t really any drive here that is trying to push the SOI into a strong positive state.

Eastern Pacific
Oscillation and Western Pacific Oscillation…
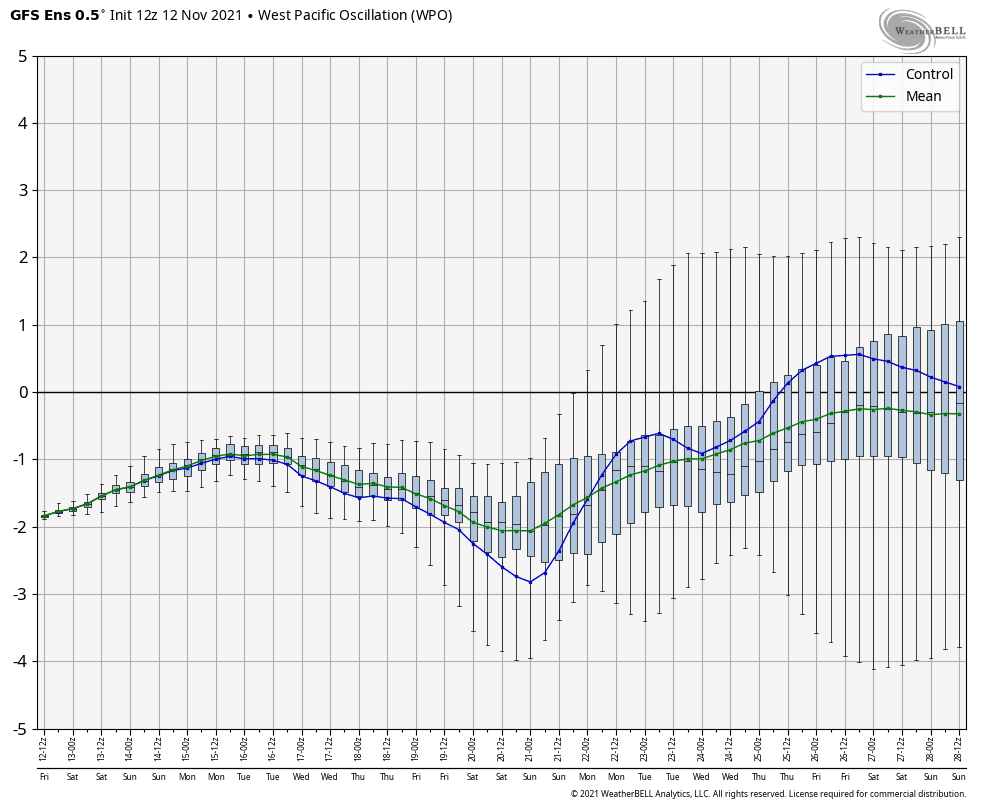
Right now,
the EPO is positive and the WPO is negative. The ensembles are in disagreement
as to where the EPO is heading, But I think the EURO has the better handle on
things. The reason for backing the EURO has the do with the WPO. The WPO is
strongly negative. The ensembles are in rough agreement that the WPO will stay
primarily negative as we move into the first half of Winter. The
WPO typically rules the roost with it comes to EPO. A negative WPO tends to
force the EPO back to negative during those times the EPO becomes positive.


The North
Pacific Oscillation…
The PDO is important because La Nina is located in the
Pacific and will be a driving force.
This PDO is Negative and on average that tends to drive colder air to
the Eastern US.
Quasi-Biennial
Oscillation…
Right now,
the QBO is negative. Typically, when the QBO as negative in November, along
with winters that experienced a weak La Nina. The QBO stayed negative for December
into March. When this is Negative during
a Moderate La Nina, we tend to get more snow.
The Pacific North
American Pattern…
The PNA is
currently slightly negative, if we want abundant cold air this isn’t a good thing.


When the PNA
is negative we tend to see a zonal (west to east) flow over the northern CONUS. The positive phase leads to a meridional (north to south) flow.
The Positive
Phase brings warmer/drier weather to the West and colder/wetter weather to the
East.
The PNA also
reflects the strength of the Aleutian Low.

Cold Pool
in the Gulf of Alaska:
Typically, during
a La Nina, we tend to see an area of 500mb low pressure stubbornly stay over
the Gulf of Alaska. This kind of setup
makes it hard to get much in the way of cold infiltrating into the eastern half
of the CONUS, as we end up with a negative PNA. We will have to watch to see if
it can be replaced with ridging during the winter or at least shift enough
Southwest of the Aleutian Islands to allow more of a positive PNA. The placement
of the cold Pool is indicating that we might see the low pressure break down or
move more to the southwest. This would lead to a better chance for cold air
into the East do to a positive PNA.
For true
cold air in the wintertime into the central and eastern CONUS; we need a
snowpack over a large part of Canada. This would help break down the Low in the
Gulf of Alaska. Otherwise, it is very
hard to have polar and arctic airmasses drop into the CONUS. This goes back to the zonal flow I was
talking about earlier, where you get milder Maritime Pacific and Continental airmasses.
The cold
pool reaches the Aleutians and south of there. This means we should see a
western ridge develop, as the western trough moves west. This would increase
the odds of a trough developing into the Midwest and Northeast, leading to cold
air trying to overwhelm the pattern for December into the early part of January.
Eurasian Snow
Cover / Arctic Sea Ice Extent:
Two other
teleconnections that I use are Eurasian snow cover, and arctic sea Ice extent
during the month of October. The use of these two has fallen out of favor in
most outlooks. But I still use them as there is a weak correlation
between them and overall winter weather here in the Northeast.
Eurasian Snow
Cover…


From the
graph of the Eurasian snow cover trends leading into
the Northern Hemisphere winter from 1967 to 2021. This chart is showing the
snowfall extent during the entire month of October 2021. From the graph above,
you see, overall, we’re running on the lower side of average. The winter of
2017-2018 had slightly less snow extent. Generally, the lower the Eurasian October
snow extent, the milder the East Coast winter.
On average
the more area snowfall coverage in Siberia in October, leads to better chances
for colder winters on the East Coast.
Sea Ice is
another thing I look at in October
Sea Ice Cover…


Average monthly air temperatures were well below freezing across much of the Arctic Ocean in October. As a result, the sea ice extent has been quickly growing, and by the end of October, ice covered most of the Arctic Ocean. Overall, the ice extent remained below average for this time of year in the Barents and Kara Seas, as well as within northern Baffin Bay and the East Greenland Sea.
In October, the sea ice extent ended up higher than any year since
2015, as well as higher than observed in 2007, 2011, and 2012.
As has been
the case for many recent years, sea ice has been running below normal, in many
cases due to long-term warming global temperatures. Although still under a
degree of research, there is a correlation that shows generally the less sea
ice present in the area of the Barents-Kara Sea, east of Greenland, moving into
the winter season, the greater the likelihood of cold snaps over North America
as the polar vortex swoops in every now and again.
Stratospheric
Warming:
I’ve been talking about the Sudden
Stratospheric Warming (SSW), that just occurred and the one that looks to take
place sometime in December. If we indeed see a December SSW it would correlate
with the cold December idea I’ve been floating around for the last few months.
Climatology:
The
Hurricane Season…
There is
some correlation between Hurricane activity in the Atlantic Basin and the
following winter.
looks like
2011 was the best analog. Especially with how the season shut down.
2004 and
2007 are also both good examples of seasons that significantly slowed down
after September. In 2004 the early season was quiet, but the months of August
and September combined produced 12 Named Storms, 9 Hurricanes, 6 Major Hurricanes.
After that there were only 3 marginal, short-lived storms.
2007 was
similar to 2021 in that there were lots of weaker tropical storms. September
had 8, but almost the whole month of October elapsed before Hurricane Noel
developed at the end of the month.
This year we
had Hurricane Sam, which racked up a lot of ACE points, we also had Tropical
Storms Victor and Wanda, these helped to redistribute heat from the tropics
into the North Atlantic. I feel this
will help make it more likely for a negative NAO, leading to a better chance
for North Atlantic Blocking to support cold air for at least the first part of
winter.
The Warm
Fall…
October has
been very warm overall. The last couple
of days have been cool. But the month as a whole, is one of the warmest
Octobers in the Northeast over the historic record.

When we look
at past years that had similar patterns to this one, we come up with a front-loaded
winter, like I’ve been talking about over the last few months.
Winters
after a wet October tend to see above average snowfall across New York State
and New England. Throw in the Warm
Summers and we even greater chances for average to above average snow.
This has
been a wet fall, on average very wet Octobers tend to be during La Nina’s. This
coronation is likely because the pattern is telling us we’re going to see a lot
of activity.
On average
Warm Summers and Falls when added to La Nina.
Some of
these occurred in:
1955-1956
2005-2006
2016-2017
Cold Mays…
There is a
moderate relationship between cold Mays and years that had an active hurricane
season, lead to an early start to winter in the Northeast and Middle Atlantic.
Years that
had cold Mays, Warm Octobers, and Octobers that had an SSW event. 1950,1954, 1955, 1960, 1979, 1989,1995.
Those winters had cold Novembers and Decembers.

Lake Effect…
Every year
the lake belts deal with lake effect.
We’ve been
very warm overall, so Erie and Ontario are very warm. Right now, the Lower Lakes are about 4-5
degrees warmer than what is considered average for November. Right now, Lake Erie has water temperatures
of almost 59 degrees, the warmest on record, more than 4 degrees above average.
Lake Ontario water temperature is at almost 57 degrees, the warmest on record,
more than 5 degrees above average.
Does that
mean, everyone near Lakes Ontario and Erie will see huge snowfall events? In
answer, that depends.
Which
leading us to The Big Question: Will these warm water temperatures play a role
in increasing lake effect snow in early winter?
First, the
actual water temperature isn't the prime factor when it comes to lake effect
snow. It’s the difference between the
lake water temperature and the air temperature of the colder air moving over
the lake surface.
Typically, as
we approach winter, the water temperature begins to drop at roughly the same
rate in September and October regardless of the highest water temperature
reached during the summer. This year the fall was very warm, so the lakes
stayed a little warmer later into the year. But by the time we get into December, the
water temperatures will likely cool off back to around average.
So, while
the lake is primed, lake snow is all about potential. Things have to line up. We need the timing
of the cold air incursions and the storm tracks to a line; Also, the Wind
direction has to be right, so areas that depend on lake snow can see large
variability within the typical snowbelt areas.
The pattern
does support several shots of cold air over the next few weeks. So, those
downwind of Lake Erie and Lake Ontario are at risk for heavier lake effect snow
events during the early season.
Solar:
When dealing
with the long term, the sun is the main driver of weather and climate on the
planet. We’re just coming out of a solar
minimum. During the winter, solar activity should stay at relatively low
levels. Low solar seems to favor a persistence
for more in the way of high latitude blocking. With higher-than-average
geopotential heights around Greenland and Iceland. The Great Lakes and East Coast tend to see
more in the way of cold air intrusions during low solar winters, which
increased the odds of seeing more snow.
Storm
Tracks:
The storm
track pattern for this winter…
Typically,
during La Nina winters we see many storms cut to our west and move over the
Great Lakes. Most of us know a storm cutting to our west places the Northeast
and Mid-Atlantic in the warm sector.
The
developing pattern supports the idea for at least a few Miller-B events. A
Miller-B means a storm that approaches the Northeast, and then transfers its
energy to the coast. These types of
storms tend to impact eastern New York State and New England more than they do
the Middle Atlantic and the rest of the region.
In October
we had to early season nor’easters. Giving the setup that looks to set up would
tend to favor a more easterly track for coastal storms. But if we can get
blocking which lines up with a coastal storm track. If this happens the Mid
Atlantic into southern New England could end up with at least one big snow
event. If my idea of a La Nina Modoki setting up, would make the chance for a
few coastal storms having at least some impacts.
Behind these
storms we typically see cold air outbreaks, where Clippers can provide light to
moderate snow events.
Conclusion:
December…
The reasons
I’ve shown above, support the idea of an early start to winter, that I’ve been
pushing for a while now. We’re into Mid
November and the pattern has already flipped to one that is overall cold for
this time of year. December looks to be very cold overall. December looks to be
very snowy as well.
January…
The CPC is
expecting the La Nina to peak mid-winter. But there are signs that the La Nina
may peak before then. So, I believe
January will end up overall mild. The pattern will still be very active, with
most of the storms cutting up through the Great Lakes. There could be a few
Miller-B storms that end up forming, but these would likely miss the Mid Atlantic,
but could favor New England with a snowstorm or two.
February
into March…
February is
the month; I’m having the biggest trouble with.
I believe it will start out with above average temperatures. But as we
get past mid-February, we could see some colder air try to move into the
Northeast and Middle Atlantic. But overall February will be a warm month. On average the month of February, has the
region seeing their best opportunity for storminess. But with the southeast ridge pushing north,
it would come down to timing of events as to which kind of P-type we end up
with. March will likely see a
continuation of the general February pattern. As the La Nina should be starting
to fade, we would be relining on other teleconnections to play a role, but the
area will likely see March with overall slightly below average, which would be similar
to the last several winters. So we could see some storminess that leads to
increased snow chances for the end of February into March.
So, this
winter is going to be somewhat similar to last winter, but with a bit more bite
to it when and where it does get cold and snowy, it also looks erratic with
changeable jet stream patterns over the December through March period, more so
than last winter.
My overall
idea for snow amount and temperature across the region…
For the
Northern Mid-Atlantic region, the pattern supports the idea of an overall above
average winter when it comes to temperature. This winter will see a very active pattern. As I said
earlier this area will be where the battle ground sets up between the colder
air to the north and the warmer air to the south. While the general storm track
won’t be favorable for a giant snowstorm, it does feature a good chance for
small to medium storms. So, while I think the overall precipitation amount will
be above average; the warmer overall temperatures will increase the odds for
more rain and ice events as opposed to snow events, so overall seasonal
snowfall will likely end up 75%-90% of average.
For the rest of New York State and New England. This part of the Northeast will likely end up with overall temperatures slightly below the 30-year average. With the pattern that looks to setup I’m thinking overall snowfall will end up being 100% to 130% of the average.
As far as
lake effect, the traditional snowbelts should end up with an average to above average
year. Inside the lake snowbelts, snowfall can very greatly over very small distances.


Some outlets
change these seasonal forecasts has conditions change during the season. But I
don’t like to do that. I release an outlook, and I live with it. I don’t know
how it will work out until the end of the season.
Well, that’s it, I put a lot of thought in this and tried to find a balance between the conflicting signals. Remember this is showing the overall snow and temperature for the entire winter. There can also be variability inside the general three areas found on my maps.
No comments:
Post a Comment
Thank you for taking the time to comment, I will answer as soon as I can.