Monday, March 23, 2020

My first official thoughts for the 2020 Atlantic Hurricane season.


Every year several private, university, and government companies and institutions make a forecast of hurricane activity. I have made one for a few years now. All in all, my Atlantic hurricane outlooks have been pretty good. 


The 2019 hurricane season:

Taking a quick look at last season.

The 2019 Atlantic hurricane season was quite active with 18 named storms. It joined 2015, 2016,2017, and 2018 to become the 5th consecutive year that started with a tropical or subtropical storm before June 1st. The 2019 season matched the 1969 season for the 4th most active season in the last 150 years.  The season started with Andrea and ended with Nestor.  The strongest hurricane of the season was major hurricane Dorian which achieved category five status, with peak sustained winds of 185 mph, with a minimum central pressure of 910 mb.

The 2020 Atlantic hurricane season will begin on June 1st and end on November 30th.

Analog years:

1933,1953,1959, 1969, 1979, 1995, 1998,1999,2003,2004, 2005,2007, 2010, 2013, 2017.

Conditions for the 2020 hurricane season:
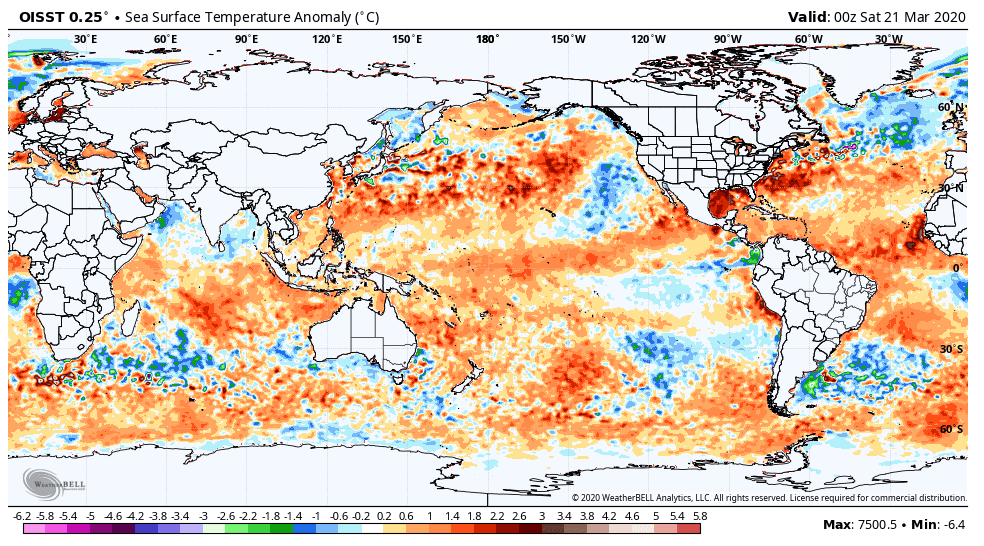
Sea Surface Temperatures (SST):

SST in the Atlantic and Pacific are warm.

Here is a look at the current SST anomalies.


The ENSO:

Right now, we’re seeing neutral La Nina conditions.

We could see a La Nina develop; if this happens it would have huge ramifications on the Atlantic Basin Hurricane season.


I’ve been talking about how this coming summer could be very warm. I was talking to my mother, she told me the last really hot East Coast Summer (air temperature wise) she can remember hearing about, was back in 1999.  There is a correlation between ridging just off the East Coast and increased risk for Eastern seaboard landfalling tropical cyclones.  

The Atlantic:

 The SST across the Western Atlantic, Caribbean and much of the Gulf of Mexico are warmer than average. These warm SSTs will help to create a more favorable environment for tropical cyclone development.  Part of the reason the Atlantic SST are so warm has to do with the Atlantic Multi-Decadal Oscillation (AMO). We’re in a positive AMO phase, the AMO has been positive since 1995.  Typically, when the AMO is in a positive phase, the tendency is for the African monsoon season is stronger and more active. That is the case this year, as there is an active Western African Monsoon (WAM) ongoing.

The Caribbean Sea and Gulf of Mexico (GOM):

The GOM and Caribbean could be very active this season.  This will be due to the warm SST and that western African monsoon (WSM). With an active WAM systems will have an easier time taking aim at the Caribbean, where they very likely could move into the GOM.

With the above average SST off the East Coast and along the Gulf Coast, could help storms rapidly intensify as they approach the U.S.

Atlantic Main Development Region (MDR):

One key to how active this season becomes will be how much the waters warm in the MDR. The last three seasons saw below average SST in the MDR; but during each of those seasons the SST in the MDR turned warmer than average, which helped those seasons become more active. We most likely will see the MDR warm up to above average during the 2020 season as well.  

The active WAM, will increase the odds for stronger tropical waves moving off the African Coast heading into the MDR.


Wind Shear:

We most likely will see neutral ENSO conditions to weak/moderate La Nina in the Pacific; this would help promote lower vertical wind shear over the Atlantic Basin.  Lower wind shear across the Caribbean during the bulk of the 2020 hurricane season. The expected conditions should also allow for lower than average wind shear in the GOM and along the East Coast during the second half of the 2020 Atlantic hurricane season. Less wind shear will also allow hurricanes a better chance to become strong.  The conditions that look to setup for June and July, should make it harder for long track systems to develop, until they get into the western Atlantic. But for August, September and October these conditions should reverse, making it easier for Cape Verde Systems to develop. A Cape Verde System is one that develops in the eastern Atlantic near the Cape Verde Islands. 

Vertical wind shear and SST in the tropical Atlantic are the two most important influences on how active a season will be.

Accumulated Cyclone Energy (ACE) ideas:

Is used to try and gauge the activity of individual tropical cyclones and the entire hurricane season. It tries to approximate the wind energy and damage potential for each individual tropical cyclone. The season ACE index is the sum of the ACEs of each storm and is based on the number, strength, and duration of all the tropical cyclones in the Atlantic Basin during the season. Looking back at the Atlantic SSTs, we can see they are very warm.  Based on the current and projected signals

My forecast for the Atlantic ACE for 2020 is 140-205. This is saying I expect Atlantic tropical activity to be very active this year.

Atlantic tropical cyclone names for 2020:

Arthur, Bertha, Cristobal, Dolly, Edouard, Fay, Gonzalo, Hanna, Isaias, Josephine, Kyle, Loura, Marco, Nana, Omar, Paulette, Rene, Sally, Teddy, Vicky, Wilfred

The Verdict:

Tropical systems get a name, when they reach tropical storm strength with sustained winds of at least 39 mph.  Once the system has sustained winds of 74 mph it is labeled a hurricane. A major hurricane is a hurricane that reaches category 3 (111-129 mph) or higher on the Saffir-Simpson scale.

Based on the idea of neutral ENSO to La Nina conditions in the tropical Pacific, an active western African Monsoon season, above average SST in the Atlantic. Along with the likelihood of lower than average vertical wind shear in the Atlantic Basin.  This could end up being a very active year.

For the Atlantic Basin, an average season consist of 12 named storms, 6 of them being hurricanes of which 3 become major hurricanes.

For the 2020 Atlantic Basin hurricane season, this looks to be an average to above average season.  My call is 15 to 19 named storms, 8 to 12 of them will be hurricanes, with 3 to 5 of those being major. 

Landfall Threat:

The type of pattern we’ve been in for the last 4 to 5 years as seen an uptick in U.S. landfalls. For 2020 that trend is going to continue. I think the U.S can expect 4-6 named storms making landfall, with 1 to 2 major hurricanes making a landfall on the Gulf or Atlantic Coast.

Based on the analogous, here are my thoughts on the predominate tracks western Atlantic Basin tropical cyclones look to take during and U.S. landfall risk during the 2020 season.


Well that is it.  Depending on how the setup and conditions change between now and June 1st, will determine if I update and revise this outlook. If I do, it will be around the the end of April to first part of May.  


Tuesday, March 10, 2020

My spring outlook


This is later than I normally post the spring outlook. But every time I would start to work on it something came up. But beyond that, I’ve been going back and forth with the idea of even posting one at all. More than a few of Y’all used my winter outlook as cannon fodder, making me feel like a long tailed cat in a room of rocking chairs. But I’ve decided to go ahead and post it……

Meteorological spring began on March 1st, with Astronomical spring beginning on Thursday March 19th, at 11:49pm. We have already been experiencing above average spring temperatures. The question will that continue?

The three major reasons winter 2019-2020 was so warm.   Was the Eastern Pacific Oscillation (EPO), a near record-breaking positive Arctic Oscillation (AO), and the powerful Polar Vortex (PV). All three of these things kept the cold air locked up well to our north.  The same general atmospheric pattern that allowed for the mild winter, has continued into spring 2020. As we move forward, the strongly positive Arctic Oscillation and the strong polar vortex are going to be very big factors for this spring.
   

Outlook Overview:

El Nino Southern Oscillation (ENSO):

So far, the ENSO is basically neutral (neither El Nino or La Nina). This will most likely stay the case heading into summer 2020.

The ENSO SST departures are warmer than average by a little over 1.0 C in Nino regions 4 and 1+2. With Nino region 3.4 coming in about half of that. Nino region was 0.1 C. That isn’t a cold signal for the East CONUS.

El Nino Southern Oscillation (ENSO) Current Status and Forecast

The Nov. 2019 – Jan. 2020 Oceanic NiƱo Index (ONI) of 0.6°C was in the weak El Nino range for the second consecutive month. Real-time sea-surface temperatures (SSTs) are near-to-above average across most of the tropical Pacific Ocean.  The Climate Prediction Center (CPC) is predicting SSTs to cool but remain in the ENSO-neutral range through this coming summer.  

Here is a look at the current ENSO status


The Madden Julian Oscillation (MJO):

Since November into December 2019, the MJO stayed primarily in the warm phases four, five, and six. But finely the MJO is looking to head into phases two and three; these are colder phases this time of year.  


The EPO:

The EPO is forecast to go very negative. This is a cold signal for the U.S, and is the opposite of what it did for winter 2019-2020. Because, typically it pushes colder Alaskan and Canadian air into the U.S pattern. The WPO is also looking to go negative, again this is a cold signal for the U.S. 


The Pacific North American teleconnection (PNA):

Currently the PNA is in a negative phase. This phase typically brings higher pressures (ridge) to the eastern US, and a trough to the western U.S. This usually brings a warmer and drier pattern for the eastern U.S.  But the PNA doesn’t really drive the pattern, it responds to other teleconnections in the Pacific, like the EPO.  So the with the EPO staying in a positive phase for most of winter 2019-2020, it’s no surprise that the PNA currently negative. It won’t happen immediately, but as the EPO turns negative, the PNA should respond and turn positive.  


The AO:

The AO is strongly positive this is a warm signal for the U.S.


The North Atlantic Oscillation (NAO):

This is the time of year, that the NAO exerts its greatest input on the atmospheric pattern.  After a brief dip into negative territory, it looks like it will head back into a positive phase which is a warm signal for the U.S.


The PV:

A warming event looks to occur in the Stratosphere next week. As I’ve said many times these sudden stratospheric warming events can affect the PV. If they weaken the PV, they can impact our weather here in the Northeast. The first warming wave will build north and enter the PV circulation. Every year, there is a final stratospheric warming event, as we proceed into spring, as the Sun starts warming up the polar region. There are signs of warming waves entering the upper stratosphere. As we head deeper into march, as the sun angle gets higher over the arctic, the PV will come under more and more pressure from these warming waves. As some point it will weaken, and most likely basically collapse.  The models are supporting this idea. So, in my opinion what we’re seeing is going to be the last stratospheric warming event until next fall/winter.  Right now, it looks like we will see two warming waves. In the image below we can see one wave over the North Pacific and a stronger one around the Atlantic. The PV should become very elongated. The models, see this happening as well. Looking at the GFS, we see the PV does become elongated. This should result in the PV splitting with  one side going over Eurasia the other over North American and or Europe.


We are currently seeing changes in the pattern over Alaska and back into Eurasia. I expect to see this evolve farther as we get deeper into March and April. The Pacific ridge that looks to build into the western CONUS, should lead to a trough over the eastern CONUS.  With this idea, we should see the pattern cool down as we get into the end of March and for at least the first half of April.  But with the warm northern Atlantic and Gulf of Mexico, those warmer Sea Surface Temperature (SST) should help bump up our nighttime lows.

The Verdict:

March

I expect above average overall temperatures for March here in the Northeast and Mid-Atlantic region.

April

April very will could be the coolest month of Spring 2020. Overall temperatures should end up average to slightly below average.

May

I expect to see overall temperatures average to above average during the first half, then ending the month well above average

Looking at Spring as a whole

March through May should end up overall above average temperatures for New England, New York State, and the eastern Mid Atlantic Region. While Southwest into southern Pennsylvania and western Maryland will see overall temperatures well above average. This Spring also looks to be overall wet. We will see dry times…but the overall active pattern should ensure overall rainfall to end up above average for the Northeast and Middle Atlantic region.

Spring 2020 most likely will see an active severe season. The Pattern that looks to setup will support a lot of severe activity. The Polar Vortex will break down at some point, allowing the cold air that has been bottled up, to drift south. The Gulf is very warm. The resulting clash of air masses, will allow for plenty of chances for severe weather outbreaks. 


Quick look at Summer 2020.

Summer could see temperatures well above average.

I will be releasing my 2020 hurricane outlook in a couple of weeks.

I hope you enjoyed reading my thoughts.