Thursday, December 1, 2016

How the 2016 Atlantic hurricane season went down......


The 2016 Atlantic hurricane season officially came to an end yesterday. The Atlantic  hurricane season runs from June 1st through November 30th.

Current 2016 Tropical Cyclone Totals:

Total depressions 16

Named Storms: 15
Hurricanes: 7
Major Hurricanes: 3

U.S. Landfalls: 5

US major landfalls 0

My Seasonal 2016 Hurricane Forecast:

Named storms: 13-18
Hurricanes: 7-10
Major Hurricanes: 3-5
Land falling tropical cyclones: 3-5, at least one will be a major hurricane.

The 2016 Atlantic season was noteworthy for several reasons.
 
 
The Accumulated Cyclone Energy (ACE) index for the 2016 Hurricane Season is 132.5
 
 
The first storm of the Atlantic hurricane season was Hurricane Alex, which formed on January 12. Alex was only the third January hurricane ever recorded in the Atlantic Ocean.

The last storm of the season, Hurricane Otto, ran its course in the final weeks of November. Hurricane Otto became the latest hurricane on record to form in the Caribbean Sea. Otto also went farther south than any other late-season storm, striking South America.

 The 2016 Atlantic Hurricane season lasted for 11 months, that makes it is the longest hurricane season on record.

That 11-month span between the first and last storms of the season make 2016 the longest Atlantic hurricane season on record.

The season was the most active season in years with more named storms than any year since 2012.

The season ended with 15 named storms (12 is normal), These 15 storms were named: Alex; Bonnie; Colin; Danielle; Earl; Fiona; Gaston; Hermine; Ian; Julia; Karl; Lisa; Matthew; Nicole, and Otto.

A total of seven hurricanes (Alex, Earl, Gaston, Hermine, Matthew, Nicole, Otto) and three major hurricanes (Gaston, Matthew, Nicole).

The strongest and longest-lived storm of the season was Matthew, which reached maximum sustained winds of 160 miles per hour and lasted as a major hurricane for eight days. Matthew was the first category 5 hurricane in the Atlantic since Felix in 2007.

A total of Five named storms made landfall in the continental  United States during 2016, the most since 2008 when six storms struck.

The Northeast and New England were pretty much spared this year, we just got brushed by Hermine, with some rain and a little wind.

I think I nailed my hurricane outlook...... I only missed in the major landfalling category.....which I missed by only 10 miles on the East Coast of Florida from Major Hurricane Matthew.
How do you think I did?


Tuesday, November 1, 2016

A recap and revised winter 2016-2017 outlook.


Just a quick update on the coming winter of 2016-2017.

Snow cover:


I've been talking a lot about snow cover, and how the greater the Eurasian snow cover grows from the 60 degree line south, during the month of October, the greater the likelihood for a cold winter in the East Coast CONUS.

Siberian Snow Cover extent.  is very impressive. You can see this year snow cover is 2nd only to 2014-2015, which was a very cold and snowy winter. You will notice that the snow growth in 2015 was close to this year. But if you remember, winter 2015-2016 was dominated by the Super El Nino, which was so strong it overrode all the other teleconnections. This year the other teleconnections will be in play. 

While I can find no real correlation between Canadian snow cover and East Coast winters.  You can see the extent of snow cover in Canada is notable. There is a lot of snow on the ground in Southeast Canada. This can only help, to keep the winter air mass over the northeast  colder.

Blocking:

The North Atlantic Oscillation (NAO) and  Arctic Oscillation (AO) are both in a negative phase right now.  So this is leading to blocking over eastern Canada and Greenland. Because of this these Canadian weather systems moving into the Northeast are much slower to depart. Therefore we tend to hang onto the cold longer. We will see this happen this coming weekend, as the Midwest and Mid Atlantic States heat up, while the Northeast stays a little cool.

The Southern Oscillation Index (SOI) is isolating back and forth. But it did jump start this pattern to a wintertime one.


Years that have weak La Nina's or have neutral conditions tend to be more prone to Greenland blocking.  So the Northeast sees more cold outbreaks, as well as a slowing down of the Clippers and Coastal storms, which helps the odds of seeing greater snow amounts.

I talk a lot about atmospheric patterns, and how they are cyclical in nature.  When a pattern looks similar to ones in the past, it is logical to expect a similar outcome.   The pattern we're now in  is similar to the 1950's into the 1960's.. I made my 2016 hurricane outlook based on analogs from the 50's and 60's.  So far I've nailed the hurricane season this year...  only missing out of a major hurricane CONUS landfall ( but to be fair, I only missed that one by a mere 12 miles).
If you look at my winter outlooks for 2016-2017 you will see that there are a lot of analog years from the 1950's and 1960's. In fact if you do a reanalysis of those years, you will see there is a striking similarity between this year's setup and those years.  you will also see how my thoughts have evolved and clarified. But overall, there hasn't been a lot of change from what I posted in September, or even before that on my Facebook Weather Page.


The northern hemisphere arctic is warm this year (as compared to average).  But years that had a lot of warmth in the arctic, tended to be cold, with lots of blocking.

I showed the other day, on my Facebook Weather Page, how the pattern is shaping up, with the trough in the Atlantic pulling west, the ridge over the East Coast  and the trough off the West Coast are also pulling west.  I said watch the trough in the Pacific Northwest, when it pulled west and deepened that was the sign that winter would begin.  All of that is currently in play.

The extent of cold in Eurasia is almost unprecedented. While the CONUS has been quite warm.  But that is about to change. The pattern change that has been occurring now for about a week, will continue.  The cold in Siberia will make its way into the Lower 48 by way of the northern jet.   I've been saying that I expect the current pattern change to be in place by the Middle of November; I see nothing that is changing my mind. In fact December could end up being very cold, very cold indeed. With the high likelihood of blocking in the North Atlantic, we have a shot at a few decent snow events between Thanksgiving and Christmas. I've been showing charts that show the Euro's long range ideas. The other day I made a chart that showed the typical La Nina storm tracks.  

The Euro long range control and mean are showing a lot of snow through Mid December.


I have very little doubt about how winter 2016-2017 is going to turn out.  It's going to be a colder and snowier winter here in the Northeast and Mid Atlantic States.  December looks to be very cold. All and all,  Northeast Maine and far eastern New England look to average out around normal.

The Great Lakes are very warm, for this time of year. So once we see more frequent cold outbreaks over the next few weeks, I expect to see lake effect snow falling across western, Upstate New York and western Pennsylvania.
Here are my updated temperature and snowfall ideas. For the snowfall outlook, I've added percentages to make it a true forecast. The snowfall is from first flake to last flake (including what we've already seen this month).  


Wednesday, October 12, 2016

My updated and final winter 2016-2017 outlook:


I issued my early winter outlook quite some time ago.
I've never issued a winter outlook that early before.  My outlook for winter 2015-2016 was just about dead-on. One issue last winter was the near record El Nino overriding most of the teleconnections.  Many of the factors from last year are still with us...but one major one is gone, El Nino. Winter 2016-2017 will feature a  El Nino-Southern Oscillation (ENSO) neutral , to weak La Nina. Therefore the other teleconnections and indicators won't be washed out.


The PDO is going to be warm. So this will allow for the western ridge and the eastern trough This was the same type of setup we saw in 2013 and 2014. For the first 10 days of October we saw a rapid expansion of Eurasia snow cover. If this rate continues for the last half of October, this would be a sign for a cold Northeast winter.

 
Snow cover in Eurasia and Canada is a little above average for this point in October. What I look for is the expansion rate below the 60 degree mark. comparing 2015 and 2016 you can see there is a lot more snow south of the 60 degree than last year at this time. The faster the expansion the colder the winter should be in the Northeast.   I expect to see snow cover in Eurasia, Russia, and Canada to increase a lot over the next four weeks.

Here is the Euro Ensemble showing what it thinks snowfall will look like by Thanksgiving.  it does show quite a bit for northern New York and northern New England....but remember the chart shows total snow falling by that date.... not snow depth on the ground....snow will come and go....but to see this much snow falling in November is above average.  So we could see a couple of storms in November.


Over the last 10 years, the Northeast and Mid Atlantic has seen a large uptick from the impacts of major snowstorms. Here is a chart that shows how the snowstorm frequency is increasing. There is also a chart by Joe D'aleo that shows almost half of the major storms to impact the Northeast and Mid Atlantic have occurred during the last 10 years.

                                              Joe D'aleo

Weak La'nina winters tend to see above average upstream blocking, So the storm tracks shift south placing the Northeast into the Mid Atlantic in the cross-hairs for big snowstorms. 

There hasn't been any change in my thinking from the early 2016-2017 outlook I posted.

Analog years: are still 1958-1959,1959,1960, 1960-1961,1962-1963 1977-1978,1981-1982, 1984-1985,1993-1994,1995-1995,1996-1997,2000-2001,2013-2014, 2014-2015.

The top five are.....1962-1963, 1995-1996, 2000-2001, 2013-2014,2014-2015.
 

This upcoming winter should be quite cold. My winter analogs are colder than my forecast, this is due to the warm Atlantic. This winter should shape up like the cold winters of 2013-2014 and 2014 and 2015.

The warm waters off the Northwest Coast into the Gulf of Alaska will be the major driver for this winter season

That warm Atlantic will hold winter at bay for the first part of winter. As I've been saying for a long time, October is going to be well above average in temperatures....November will be above average as well, I do expect to see a few snow events in November, but nothing lasting.  One thing seems evident to me, we're going to see an abrupt change to winter this season. I'm not sure when this will happen. For this reason December is tricky. Those warm Atlantic SST could cause issues. But,  a big part of December into the first half of January could quite cold.....I think December will end up with overall temperatures being below average. With the  cold building in for January, February, and March.

As we've seen this Summer (which was exactly like I said it would be...hot and dry) The warm Atlantic helps promote a eastern ridge in the Summer. This same thing will be the case for October and November. But after awhile the warm Atlantic becomes our winter friend.....the warm Atlantic should help lend moisture and warmth to promote quite a few storms.  With the cold in the Midwest into the Northeast....we should be ground zero for the battleground between the two. So if we can get some decent blocking from time to time.....we could see a few severe Nor'easters.  Often during a weak La Nina, the Southeast U.S. sees a warmer winter, due to some ridging. So I don't think the eastern trough will be as deep as we saw in 2014-2015. So while cold, we most likely won't be quite as cold overall, as we were in 2014 and 2015. The blocking this year most likely won't be locked in; so location of the block will determine when we see warm ups and cool downs.   

This is going to be a big lake effect winter...I expect well above average lake snows this season...Of course, lake effect is dependent on wind direction, so not all areas in the lake snow belts will see well above average snow amounts....but the lake snow regions will see heavy snow on average.  We most likely will see some big lake events earlier in the season.
There are no changes to the charts I posted in the earlier outlook.........


Friday, September 9, 2016

My early 2016-2017 fall and winter outlook.

We're getting close to that time of year, where many start to wonder about the upcoming winter. I do want to remind Y'all that this is only September, so there could be changes in the final outlook that will be posted mid October to early November. I don't anticipate many changes, but I do want to leave myself some wiggle room.
Over the few years I've been doing seasonal outlooks; I've learned what works for Y'all, and have adapted how these read. This year, I'm staying away from the science and math, and just using plan speak. I hope this is better understood and appreciated.
Remember, a outlook is about the general outcome...it is not going to tell you when, who, or how much any storms will impact.     
Fall 2016:
September 2016: Above average temperatures are expected with below average rainfall. The current drought will negatively impact fall foliage.
October 2016: above average temperatures with close to average precipitation. The pattern of  above average temperatures will continue into October.  Precipitation will be in the form of storm systems along with cold fronts. Tropical moisture could bring need moisture...but that can't be forecasted this far in advance.  A few high elevation snow showers in northern New York State and northern New England.
November 2016: Slightly above average temperatures along with average precipitation. Precipitation will be near-normal. We will likely see lake effect snow beginning in Late November.
December 2016: Average temperatures and average precipitation. Winter will not really get going until January. But there could be an event or two somewhere in the Northeast.  Lake effect snow will likely be slightly above normal.
Winter 2017:
The outlook is based on analog winters that had a similar setup and pattern.  It is also based on days of research in other metrological areas.
Analog years: 1958-1959, 1959-1960, 1977-1978, 1981-1982,1993-1994, 1995-1996, 2000-2001, 2013-2014, 2014-2015.
I came down to four analogs that matched the closest to what I'm seeing, 1958-1959,1959-1960, 2013-2014, and the top analog was 1993-1994. 
Teleconnections:
Let me address the big elephant in the room. The ENSO .. La Nina is going to be very weak to neutral.
A weak La Nina increases the odds for a colder winter in the Mid Atlantic and into the Northeast. The odds across the region are. 60%-70% chance for a cold winter. Snowfall amounts for the entire region are less clear...about 50%-50% for above average snowfall.  But when you place New England, New York State, and Pennsylvania in on group and Maryland Delaware, into New Jersey in another the odds of above average snowfalls increase for New York, New England and western and northern Pennsylvania.
The warm Pacific Decadal Oscillation (PDO) is going to make it difficult to allow any kind of La Nina to make inroads into the pattern.  Once we get into January 2017 the PDO will be the main driver for the Northeast winter in 2017.
The Warm Atlantic Mutidecadal Oscillation (AMO). The temperatures in the Atlantic are ridiculously warm. It will take a while for these to knock back, So they will be a major influence for November and December, and should negate much of the cold that tries to come into the region.
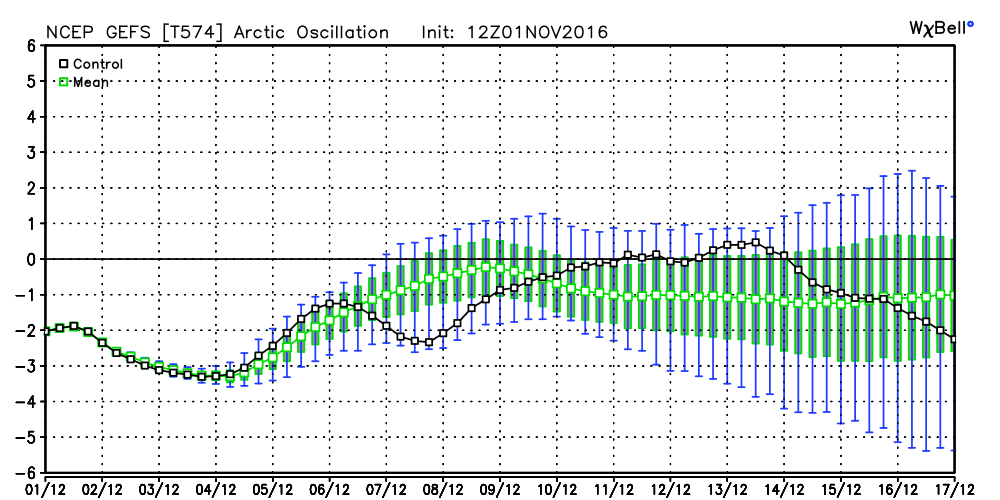
  Solar Cycle 24
This solar cycle has been very inactive.  Looking back at over 60 years shows years that have low sunspot activity, tend to be weak or neutral La Nina's, during the winter season.

Here is a look at the solar cycle and how the 2007 into 2011 ended up quite cold during that time.


2007 into 2011 saw a very weak solar cycle. This was the quietest the sun had been in over 100 years......During that time we saw cold winters.  In 2010 we also had a persistent negative North Atlantic Oscillation(NAO) and the winter was dominated by a strong negative Arctic Oscillation (AO).

When the NAO and AO are in the negative phases, the Northeast tends to see cold outbreaks and we have an increase in storminess.
My discussion :
September is looking to see a few colder shots into the Plains mid to end of the Month. But these troughs of low pressure will lift north and east mostly over the Great Lakes, and moderating as it heads into the Northeast, So we will see coolness this weekend into the first of next week...with another shot of cool coming around the 15th -18th. But the month will end warm.
Seasonal patterns are strange creatures, most of the same things that caused the hot dry summer and fall  will cause Jan-March to be cold and snowy.  The Jet Stream is strongest in the winter, due to the temperature difference between the warm and cold air masses. The Polar Jet normally moves out of Canada and setup up to the south of the Northeast and Ohio Valley during the winter. As I already said the longwave (Rossby Wave) length increases in the winter and shortens in the summer, staying away from the physics and math equations.....it is mainly because of speed and frequency.
Here is a look at the summertime and wintertime positions on average.

Here is the Palmer Drought Index graphic.  

This shows how the jet stream pattern has caused the constant heat dome over the East Coast this Summer. During the Summer the atmospheric wave lengths shorten up.....but during the winter the wave lengths get longer.  Another factor for this hot summer, has been the warm Atlantic Sea Surface Temperatures. 
The PDO.  A major player is the persistent ridge over the Rockies this Summer, because of the shorter wave lengths, this lead to a Midwest trough, with a ridge on the East Coast.  The placement of the warmth in the Gulf of Alaska has been just far enough west, for the Summer, that the East Coast just couldn't shake the ridge. So we fried this summer.  
Back in the 1950's we had the same PDO setup, those were cold winters in the Northern CONUS.
The warm PDO will setup a ridge in the West and a trough over the Great Lakes and East. So cold air in Alaska, Siberia, and Canada, will be able to slide down that trough into the Northeast.
We look to see a lot of cold pooling up in Central and Eastern Canada. With warmer temperatures over the Gulf states. This would greatly increase the odd of several cold shots out of Canada, with a active storm track between the two air masses, leaving the Lower Great Lakes, Northeast, and Mid Atlantic in the battleground for possibility some sufficient winter storms .
Like 2014-2015 this is going to be a tale of two winter...the first half will be mild due to the Atlantic warmth.  The second half will be quite wintery and cold.  The Atlantic is going to be a wildcard this season. All that warmth makes it difficult to ascertain its impact. So I'm guessing a little more than I normally would.
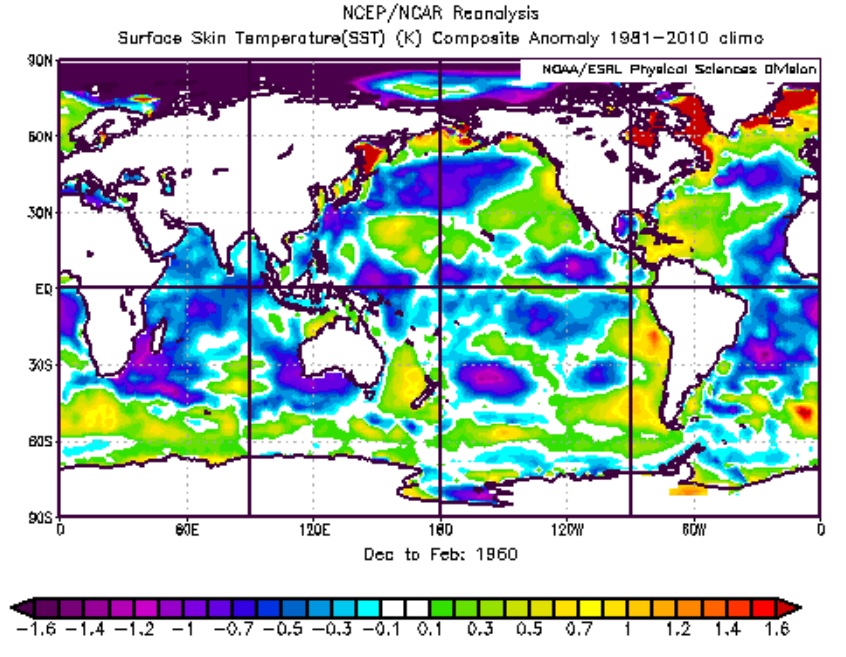
The Current Sea Surface Temperature (SST) setup.

Here is a look at the four top analog years


Here is a blend of all those winters
You can see the impact of the setup on  500mb level temperatures.

I think the analogs are a little too cold......So I've raised temperature outlooks a little....but even so, this winter is going to be below average when it comes to temperatures overall on average.
The bottom line:
The Northeast and Mid Atlantic is going to see lots of snow this winter. The entire region will see above average snowfall. Lake Effect Snows, will be well above average.
Here are my charts showing my thoughts on temperature and snowfall.


I will be posting a updated outlook for Winter 2016 - 2017 Mid October into the first of November.  

Rebecca

Friday, May 6, 2016

My Final and Official 2016 Atlantic Hurricane Outlook.


The preliminary 2016 hurricane outlooks can be found at these links.
My first thoughts. 

2nd preliminary

This outlook was derived from determining all the likely scenarios, that I could envision.  I looked at past analog years, and did a percentage of probability, to try and determine what 2016 most likely will see.     

Everything within this outlook is a result of my analysis, and I'm solely responsible for the content. This outlook will explain not only what the number of tropical cyclones will be, but I will also show data and try to come up with what impacts there could be with land falling systems.  

The official Atlantic hurricane season runs from June 1  to November 30

SOI:

SOI values for 06 May 2016

Average for last 30 days         -16.72

Average for last 90 days         -14.75

Daily contribution to SOI calculation  10.36


The SOI is  into the positive side of the scale. It will most likely go negative again, before it goes positive again mid May.

Oceanic Nino Index (ONI):


Nino 3.4 forecast:


Analog Years:

1958, 1973, 1988, 1995, 1998, 2007, and 2010, The closest match to this year, seems to be 1958 and 1998.   

1983 was a transition year, but I didn't use it, because of the eruption of the El Chichon Volcano that year.  1982 was a Super El Nino that transitioned into a La Nina in the Summer of 1983. The 1983 hurricane season saw only four tropical cyclones. Because  the Volcano disrupted the 1983 pattern, I threw it out. 

Teleconnections:

First of all this is a El Nino to La Nina transition year. Transition years normally see more in the way of an active hurricane season.

The Atlantic Mutidecadal  Oscillation (AMO), has been generally positive for the last 10 years or so. The AMO is looking like it's in the process of doing a reversal. You can see how warm the  tropical Atlantic basin and off the East Coast of the United States are.  In fact the SST's in the Gulf of Mexico and Western Atlantic are warmer than most of analog years.

The  North Atlantic Oscillation (NAO) was positive for a lot of last winter, but now the NAO is more negative. In the spring this is an indication that the Azores High Pressure will be suppressed. This should allow for weaker easterlies; which in turn would allow for less Saharan Air Layer (SAL) dust in the tropical cyclone development zone. Instead there would be more moisture available for tropical development. With the Azores high pressure looking to be somewhat suppressed, it should help us see higher  Accumulated Cyclone Energy (ACE), which would increased the odds for more and possibility stronger tropical cyclones. 

In spite of the fact that the 2015 Atlantic Hurricane Season was an El Nino year with overall hostile conditions. We saw quite a few tropical waves. These helped to keep enough moisture in the Atlantic Prime Development Zone; that we saw tropical cyclones like Fred, Grace, and Ida.  

 If the high latitude blocking continues, the Atlantic SSTs could get a lot warmer.

Accumulated Cyclone Energy (ACE):

Total ACE looks to be 110-145 for the 2016 Atlantic Hurricane Season. Also at least half of the ACE points look to be in the Gulf of Mexico and western Atlantic Basin.


The warm Atlantic and tides:

The Main Development Zone in the Atlantic heated up rapidly in April, along with the Gulf Stream slowing down for two weeks. Tides along the Southeast Coast have been running a half foot to a foot above average since mid April. The same area has seen wind changes, caused by the an atmospheric bridge formed because of the El Nino in the Pacific; This in turn has heated the north Atlantic.

One reason for the quick warm up in the tropical Atlantic, is due to areas of low pressure forming along the subtropical jet atmospheric bridge; this has weaken the trade winds in the Atlantic.


An atmospheric bridge of strong winds is carrying heat and water vapor from the tropical Pacific to the tropical Atlantic. In the image above, you can see winds at the 250mb level, along with water vapor levels over the western hemisphere on 3 May, 2016. There is a large area of convection caused by warm air south of Mexico. All of this has injected heat and water vapor into the atmosphere.  
 
The second reason is the fading El Nino  intensified the rising motion of air over the northeastern Pacific Which increased substance over the tropical Atlantic.

More uplift than normal (green) has been caused by warm El Niño waters in the north eastern tropical Pacific. The tropical Atlantic south of the equator has had more subsidence than normal (brown). There has been above average  uplift induced by El Niño. This has shifted surface pressure patterns, caused a southwesterly wind anomaly in the tropical north Atlantic.


Both the  weaken trade wind flow and increased substance, is the reason for the rapid warming last month. This southerly flow caused cooling  along the equator in the Atlantic and warming north of the equator. 

 Many have been talking about the area of cold SSTs (cold blob) south of Greenland. There felt that this would actually cool the tropical Pacific. But because the 2015 El Nino lasted into the Spring of 2016, the southerly flow allowed for very strong high pressure around Greenland, which considerably warmed the SST in the area that was the cold blob. The CFSv2 has seen the demise of the cold blob.   

These same processes happened during the intense hurricane seasons of 1998, 2005, and 2010.  

This is all very important to understand, The Gulf Stream is mostly wind driven. When the trades weaken the Gulf Stream slows down. All of this leads to increased tides in the Caribbean, GOM, and along the East Coast from Florida to New England.

Preliminary water levels from Fort Worth pier, Florida, near where NOAA observes Gulf Stream flow. Note the jump in water levels to up to 1 foot above normal occurred at the same time as the Gulf Stream slowed.
The Gulf Stream typically flows in the low to mid 30 Sverdrups. It slowed to 19.8 on April 18, 2016. The last time a day had so little flow followed hurricane Sandy's disruption of the Florida current in late 2012.
Back in 2005 we saw the Atlantic heat up like it is in 2016.  One thing that is different is how much warmer the SSTs off the East Coast are this year compared to 2005. Another thing that is different is the tides along the East Coast are higher this year, then they were at the same time back in 2005.  

You may say, "OK so what!". The Atlantic cycle is such, that ocean surface heights are at their highest in Fall, and the lowest in the Spring. This means we can expect surface heights to increase for the next six months......in other words.....the tides will keep getting higher into fall of 2016. 

Putting it all together:

The El Nino has weakened a great deal, and the change to La Nina is very apparent. 

During this La Nina event, vertical wind Shear is going to be below average this hurricane season.

The last several years have seen more in the way of recurving tropical cyclones.  But with the SSTs in the Atlantic showing a definite shift toward a negative AMO, being quite warm. The African easterly jet, will be slower, giving time for systems to get their act together as they work west. With over half of the ACE points in the GOM, Caribbean, and western Atlantic, there will be increased risk for Gulf Coast and East Coast land falling tropical systems. 

Factoring all of this in, the 2016 Atlantic season will be quite interesting. The conditions in  Atlantic are prime for much above average tropical cyclone activity this year.  

We've already seen one hurricane in 2016. Hurricane Alex formed in the Atlantic January 13-17, 2016.

Based on what I've outlined, this is my call for the 2016 hurricane season.

13-18 named storms (This includes Alex)

7-10 hurricanes

3-5 major hurricanes

3-5 land falling tropical cyclones, at least one will be a major hurricane.

Impacts: 

Massachusetts Institute of Technology Professor Kerry Emanuel, is one of the leading authorities on atmospheric convection and the processes that intensify hurricanes. He has written books, papers, and made presentations on the physics of hurricanes. Even though he sits on the other side of global warming debate from my side.... I still have a lot of admiration and regard for him.  Professor Emanuel has written on how water temperature and hurricane activity has a direct correlation.

The SSTs in the tropical Atlantic MDZ is cooler than it was in 2010, but about the same as they were in 2005.  The strongest hurricanes need warm water under the surface.  The heat content of the Atlantic  is quite high.  Also the SST's off the East Coast are very warm.

Even though the Gulf Stream has returned to normal near Florida, tides along the East Coast remain high.  As the Pacific El Nino fades, and the tropical Atlantic warms weakening the trades. I expect to see more occurrences of the Gulf Stream slowing.
The 2016 Atlantic Basin Hurricane Season has me worried. The combination of warm SST in the GOM, Caribbean, off the East Coast, as well as in the MDZ in the Atlantic...speaks of the possibility of intense hurricanes (like the hurricanes of 1954).  With the high water in the Atlantic; I feel the risk of particularly destructive storms, making landfall on the East Coast or Gulf Coast is high. 

Everyone who lives on the East Coast and Gulf Coast, should review their hurricane plans, have their hurricane emergency kits ready, and pay attention to what the National Hurricane Center has to say.

That's it, thank you for taking the time to read. I would love to hear from you, either on here or on my Facebook pages.