Monday, December 31, 2018

Sudden Stratospheric Warming , the Polar Vortex , and what it all means


Lately I've been talking a lot about Sudden Stratospheric Warming (SSW), the Polar Vortex (PV), and many teleconnections.  Karen Drosehn asked me to go into how SSW and PV work and how they affect our weather.  She isn't the only one asking questions about all of this. So here is a post that will hopefully clear up some of the mystery surrounding all of that. This is all very complex, but I will tone it down as much as I can.

Global wind patterns and Jet Streams:

Layers of the atmosphere
  
Before we get to the Polar Vortex, I want to quickly mention Jet Streams.  Air flows from high pressure to low pressure. This creates a force called a pressure gradient, which we just call wind.. This is because warm air is less dense than cold air, since nature likes balance, wind flows from higher pressure (warm air) to lower pressure (cold air) to try and restore this balance. When warm air rises colder air will rush in to replace it.  Since the tropics around the equator are warmer than the Arctic and Antarctic near the poles. winds move from north to south. They want to go in a straight line but since the Earth is rotating they can't go straight. The spinning Earth's momentum causes something called the Coriolis Force . This force is created, because the Earth's surface rotates faster at the Equator than it does at the Poles (Because the Earth is wider at the Equator). Because of this force the trade winds in the Northern Hemisphere and Southern Hemisphere curve to the left (east to west), this is why they are called the Easterlies. The trade winds sit at 30⁰ north and 30⁰ south  . In the Northern Hemisphere the Westerlies move  west to east (from southwest) and sit between 30⁰ north and 60⁰ north . In the southern Hemisphere they blow from the northwest. It should be noted that there are three global circulations in the Northern Hemisphere, and three global circulations in the Southern Hemisphere. The polar winds sit at 60⁰ to the Pole, they blow from the northeast in the Arctic, and from the southeast in the Antarctic, These winds are called the Polar Easterlies.  The farther north we go the cooler the air 
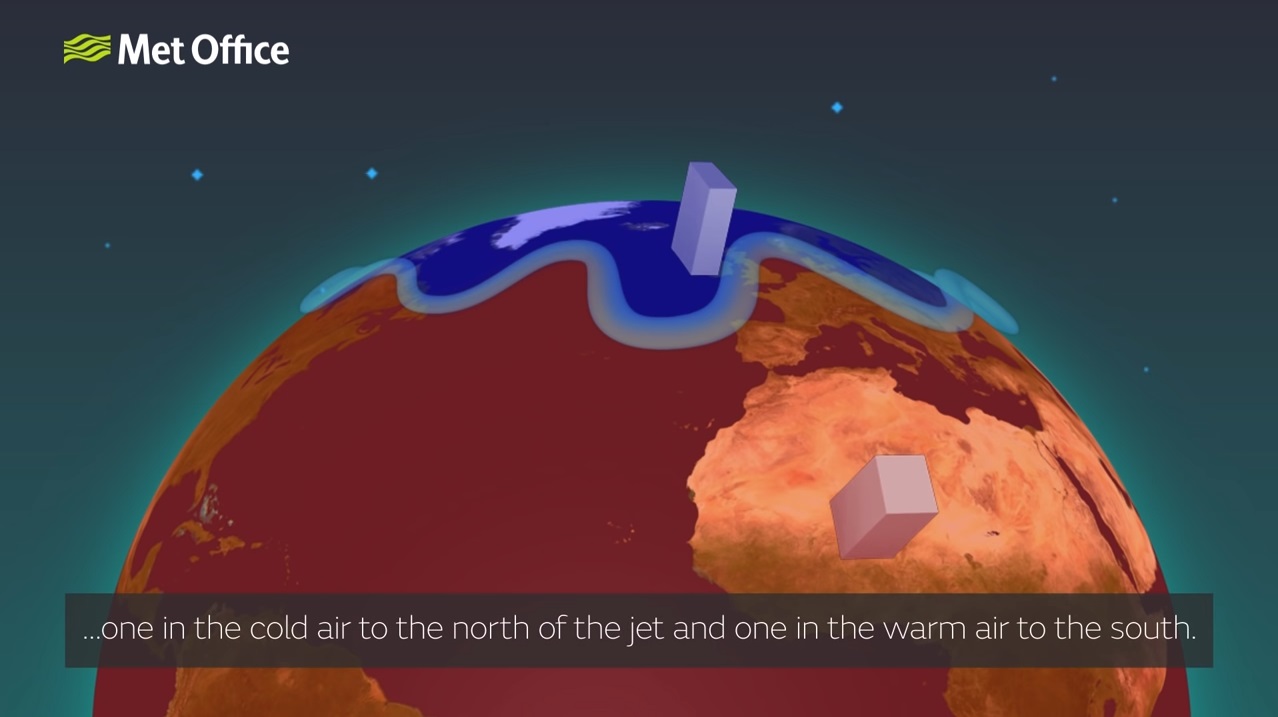
gets. The Jet Streams are created from this difference in temperatures, and form along the boundaries of the warmer and colder air masses. The larger the temperature difference the stronger the jet.  


The Jet Streams Are like narrow rivers of strong wind in the upper atmosphere.  In the northern hemisphere and Southern Hemisphere the major jet streams blow from west to east.   The main Jet Streams drive high and low pressure systems.  The location of high and low pressure centers, warm and cold air, and seasonal changes force the Jet Streams to wonder north and south, and form troughs (dips) and ridges (rising). These spinning eddies can disappear in one spot and reappear somewhere else.

Here are some illustration that show how all of this works.


That covers a lot of ground in a very short time...but it covers the basics of how things work.


What is the Polar Vortex?

The Atmosphere is composed of many layers; the closest to the surface where we live is called the Troposphere. The PV's are really just a set of two jet streams, two over the northern Hemisphere and two over the Southern Hemisphere.   The jet stream most of us  refer to as the Polar Vortex resides in the Stratosphere ( a layer above the one where we live), and is technically called the Stratospheric Polar Vortex (SPV) . The Northern Hemisphere SPV is an area of low pressure that consists of a strong circular  westerly wind field over the Arctic. The SPV keeps the bitter Arctic air bottled up over the North Pole. As long as the SPV stays strong enough, the frigid cold stays locked up in the Arctic.  But sometimes the SPV weakens enough for some of this cold to escape and head south into the mid latitudes; this is where the SSW comes into play.

The second polar vortex is called the Tropospheric Polar Vortex (TPV). Whereas the SPV only appears during the dark arctic winter, the TPV is a yearlong atmospheric element that sits over the Mid Latitudes. It is driven by the differences in temperature between the Arctic and mid latitudes.  This vortex is the one that is commonly called the polar jet stream or northern jet stream.  The TPV is farther south during the winter, and farther north during the summer.  

The subtropical Jet Streams are south of the Polar Jet Stream.

Here is an illustration that shows both of these polar vortexes.   


The distinction between the two is important. But for the purpose of this post I don't really need to go into all of that. To keep things easier to understand, from here out, I will refer to the Stratospheric Polar Vortex as just the Polar Vortex (PV)

Sometimes the normally western flow of the PV is disrupted by weather patterns or strong disturbances in the lower atmosphere.  These things can cause the PV to wobble (become wavy). If you could see it, the process would look like waves breaking on the beach.  Sometimes these waves can become strong enough to weaken the PV , reverse the easterly flow around the Pole, or even cause the one main vortex to split into two or more separate vortices.  This is exactly what happened in 2014, The PV dramatically weakened. This allowed a large area of high pressure to develop over Greenland, which blocked the cold air from escaping .  So a piece of the PV broke off and plunged the East Coast of the CONUS into extreme cold.     


What is a Sudden Stratospheric Warming?

A SSW is a very rapid warming in the Stratosphere over both poles. It is one of the most extreme changes of weather on the entire planet.  In the space of a week  arctic temperatures at the pole between 10 km and 50 km can increase by more than 90 F.   

Stratospheric warming is caused by atmospheric waves in the troposphere. The waves are forced by things like mountain ranges and the contrast between land and oceans. These planetary atmospheric waves can only move around the Earth's atmosphere in westerly winds. Weather systems and other lower atmospheric fluctuations force the waves to rise into the stratosphere, where they can go no farther and the waves break and reinforce the easterly winds making these easterlies to lower. This causes the PV to wobble. As this process continues the easterly winds are forced even lower into the troposphere as the air in the stratosphere collapses and compresses.  The result of this, pushes the PV away from the Poles, forcing warmer air in the mid latitudes to move north to replace the colder that has been displaced,  and as the air moves downward the polar region warms.

None of this happens overnight. It can take a few days to a few weeks for a SSW to take place.  It also takes a week to three weeks for the arrival of arctic cold into  North America, Europe, and Asia.  There is no guarantee that a SSW will result in arctic cold in the CONUS, it can to into Europe, or Asia instead. 


What is happening right now and analysis on where I think we're heading?

I know many of the snow lovers are preaching doom and gloom. But IMO this is all totally uncalled for.  I was saying well before Christmas, that we would see changes around Christmas and soon after. I said then the models would start to see the atmospheric pattern change  around Christmas/New Years, and that is exactly what is starting to happen. We're about to see arctic air enter the pattern. I think that is a good thing.

This current SSW is very impressive. Here are some images from the Japanese Meteorological Association showing the warming and the sharp spike in the temperatures.   


Currently the stratospheric PV is very elongated. The axis is from around Norway down to Southeast Canada. We also have ridging sitting over eastern Siberia and Alaska.  I think we will see the PV split , over the next few days.  Then we will see the cold air spread out and blocking should set up.  I would estimate that to occur between January 10th and 20th. As I've been saying for weeks, the timing looks to be around mid month.


Right now, we have a lot of low pressure sitting over Canada. This allows the air over the Pacific to enter the North American pattern.  So we end up with the mild conditions we've been experiencing the last two / three weeks.

As this current Stratospheric Warming collapses and works its way down, the stratosphere expands and the troposphere compresses. So we see the temperatures  climb dramatically in the stratosphere, like we see in the image. This will cause the pressures to rise. This results in high pressure over Canada into the CONUS, the exact opposite of where we're at right now.

The data suggest that after the PV splits, the heights will lower and coldest temperatures will sit over three regions in the stratosphere....western Asia/eastern Europe, the North Pacific, and Southeast Canada and the Northeast.  It looks to be a slam-dunk for western Asia/eastern Europe, the North Pacific. But for Southeast Canada and the Northeast the odds are a little less sure.  But before we can count our chickens, the troposphere over the arctic needs to warm.  A warmer arctic means a much higher likelihood for harsher winter weather here on the East Coast.  A split will also favor the cold sticking around for awhile, something else I've been talking about. The models have been having a hard time figuring out the pattern. But they are starting to see what is in the near future. Once the arctic warms a bit, the models will be able to handle everything much better.    
I've been talking a lot about the MJO and all the other teleconnections. Most of these things are going in the direction they should be, if we want cold and snowy. The truth is the SSW is just icing on the cake. Even without the SSW, these other factors would make for a colder and stormier winter pattern for us in the Northeast and Mid Atlantic. 


Friday, November 30, 2018

Winter outlook update.


My first winter update installment was issued well before any of the other outlets. I also issued my official winter outlet near mid October. This outlook was also ahead of most of the local and national weather outlets. Some of you have noted that several weather outlets have updated their winter outlooks to look like mine.  There is nothing new in this post that wasn't in my three preliminary and my official winter outlook. But I do try to shed more light on why I think what I do.  Here are the links to these previous outlooks dealing with this winter.

The Euro Weeklies show more cold than they did...but I think they are still under doing the amount of cold for the first part of December. I still think a warm up is coming Midmonth. Again, I think it will not be a blowtorch but surface temperatures will still be above average.

I see many are still freaking out about the coming warmth.  I'm not sure why, the season is just in its early stages. We all have to try and keep things in some kind of perspective. We just had Thanksgiving a little more than a week ago. A Thanksgiving that saw many long standing record cold temperatures get crushed. We've already had a few Nor'easters, interior snowstorms, and some lake effect events.  If what we've seen is a preview of the coming winter (and I think it is) winter lovers have no reason for all the angst.


The vast majority of the cold air in the Northern Hemisphere is and has been sitting over North America.  Canada is almost completely covered with a snowpack and  a little more than a third of the CONUS has snow on the ground.  So far November has brought the Northeast overall well below average temperatures.


As I've been saying for over a month, Arctic Sea Ice extent is expanding fast. Here are a couple of Charts, showing we're seeing more ice than we've seen in a while. In fact, we're on the cusp of seeing more ice than we've seen in 8 years. Arctic Sea Ice is also much thicker then we've seen in recent years. So the idea that the Northern Hemisphere, particularly North America is so cold, shouldn't be a surprise. The reason for this is the negative looking  Atlantic Multidecadal Oscillation (AMO).


Above Images are from the Nansen Environmental & Remote Sensing Center.   

When we look at global sea surface temperatures (SST) charts; we see the cold signature of a negative AMO. I will come back to the AMO in a bit, because it is going to play a big part in the upcoming winter. We also see the El Nino looking very El Nino Modoki like. There is also the cold east Indian Ocean and the warm blob south of Alaska.  All of these things effect where the air will rise and where it is falling.  When we have sinking air in the eastern Indian Ocean; the atmospheric wave pattern is such, that we tend to see a trough over eastern North America. The warm blob in the North Pacific and the Modoki will work hand in hand to pump that western ridge. Again these are cold signals for the Eastern CONUS.  I will come back to the Indian Ocean and the Warm Blob a little later.
Above Image are from WeatherBELL Analytics

The pattern I've been talking about all year, is responsible for all we've been seeing.

The Northeast just saw the coldest Thanksgiving in at least a 100 years. This is just a sample of the cold air that will be available for the pattern to tap into for this winter. The combination of a negative AMO and a Modoki El Nino will be a tag team for a lot of cold this winter.

Going back and looking closer at some of the things above.

The El Nino-Southern Oscillation (ENSO):

The ENSO is about the temperature difference in the SST in a specific part of the equatorial Pacific. If it's warmer than average it's called El Nino; if it's cooler than average it is called La Nina.  El Nino and La Nina will affect our weather pattern in the East for months at a time.

The ENSO is still officially in its neutral phase.  But looking at the SST and subsurface temperatures we can see it is very close. A El Nino could be declared a little before Christmas, if not then by the middle of January. This is going to be most likely a weak El Nino; there is a correlation between weak El Nino and above average coastal storms heading up the East Coast.  If the Cold locked up in the North can coincide with the these coastal storms, snow lovers will be very happy.  This El Nino, looks to see warmer than average SST near the Central Pacific instead of farther East and closer to South America.  So a Modoki El Nino is my call for what is coming. I've had this idea since Spring, and I haven't changed my mind yet!

We saw very strong El Nino's in 1982-1983, 1997-1998 and 2015-2016. These El Nino's kept the cold air locked up in the Arctic and allowed for a flow that had systems from the Pacific moving straight across the CONUS. This is a pattern that brings much milder than average conditions to the Northeast and Middle Atlantic region. These winters also saw well below average snowfall. For the winter of 2015-2016 Buffalo only received slightly more than 55 inches, which is almost half of their normal average.
Above images come from the NOAA Earth System Research Laboratory.
Above images are from WeatherBELL Analytics.
I'm 95 percent sure we will see a El Nino Modoki this winter.  This will promote troughiness over the north central Pacific. Which will in turn set up a high pressure ridge over the West Coast. This will split the Pacific flow and the storm track. The ridge will displace the cold air to the north, and send it south toward the Great Lakes and East Coast


The Warm Blob:

This year's blob isn't as warm as the one we had, during the winter of 2014-2015. .

The AMO:

 The Atlantic has a definite negative AMO look to it.  I've said it before, and I will say it now. We're entering into a negative AMO.  Phases of the AMO last 20-40 years. The AMO has a big impact on Arctic temperatures. This is because the Arctic is exposed to much more of the Atlantic Ocean, than it is to the Pacific Ocean.  Above, I've already talked about how Arctic Sea Ice is rapidly increasing and that it is thicker than we've seen in recent years. The reason the Arctic is freezing up faster, is because of the AMO going into its colder phase. If you think about it; this explains a lot of what is going on in the Northern Hemisphere.

The warm water off the East Coast:

 Those warmer waters in the Western Atlantic will mean any storms moving up the East Coast will have a tendency to intensify very quickly. The stronger the coastal low is, the more cold air it will pull into the Northeast and Mid Atlantic Region. As the storm gets stronger it will start to generate its own cold air.  This will help increase the odds and amounts for snow.  With the trough looking to predominately set up over the Great Lakes into the East, we will have a very active storm track bringing storms to the Middle Atlantic and Northeast. Again more cold air with increased chances for storms equals a greater chance for a snowy winter.     

The Pacific Decadal Oscillation (PNA):

The PNA is going to be predominately positive this winter. When we have a PNA that is positive we tend to see a ridge of high pressure over the West Coast into Western Canada. The ridge in the West helps build a trough in the East.  With the PNA positive it will amplify the effects of the Warm Blob in the Gulf of Alaska.

 The Indian Ocean:

The cooler water in the Eastern Indian Ocean is important as we move into Winter 2018-2019.  Were we see colder sea temperatures we tend to see sinking air over that area aloft.  The water temperatures in the Indian Ocean are a part of the MJO. Those cooler waters west of Australia will inhibit convection (storms). Because of this the SOI will likely stay in the negative numbers for a big part of winter 2018-2019.

The MJO:

A couple of weeks ago the Madden-Julian Oscillation (MJO) did briefly go into the warm phases 5 and 6 before shifting quickly back toward the colder phases. The Euro and GFS are both showing as the MJO moves into and through the phases 7-1, it will rotate once again into the warmer phases 3-6. But has it just did the MJO quickly moves into the NULL and then back into the cool phases for this time of year.  Here is a look at the MJO phase correlation charts. During November the cold phases are 7-1 are cold here in the Northeast and Mid Atlantic. Whereas phases 4,5,and 6 are the warm phases. As we move from December into January the impact from the MJO phase progression shifts a little. So for January the cold phases are 8,1, and 2.  As we move into February and March phase 3 will become a cold phase. If you've read my winter outlooks, then you know I think the MJO will primarily stay in the cold phases for winter 2018-2019.

The MJO has been hanging around in phases 7-2 a lot this year. During the hurricane season this lead to Florence and Michael acting the way they did, and making a U.S. landfall.  As I said earlier the impact of the particular MJO phase differs depending on the time of year we're in.  This time of year being in those phases means the Northeast and Mid Atlantic region is cold.  In my Facebook and blog post this year, I've been taking a lot about the idea of a Modoki El Nino.

The MJO is a wave of tropical activity that propagates (moves) eastward around the globe. As the waves propagates it strengthens and weakens along the way. This is where the MJO phase diagrams come in that I show all the time. These allow us to see what each model thinks will happen with the MJO.  The strength of the MJO is signified by how much amplitude (distance) it is from the center of the diagram. The higher the amplitude the more the impact is felt.  In the center of the diagram is where the MJO loses a lot of influence on the pattern.  When this happens, the pattern kind of goes into a holding pattern. The pattern is then determined by how strong and in what phase the MJO was in before it entered the low/null MJO center. It's like when you put your song list on repeat.  This is a very important concept to understand.  During La Nina the MJO is very active and highly variable.  But during an El Nino Modoki, the MJO tends to become less active.

I've talked about the weak El Nino Modoki and how the MJO has been staying in phases 7-2 a lot this year.  Both of these things tie heavily into how cold it gets this winter.  During most of the Modoki El Nino's the MJO likes to move into the null phase end of December into the first half of February.  This year we have a lot of warmth in the Pacific, This could keep the MJO more active than a typical Modoki El Nino. The pattern we've see with the MJO  staying habitually in phases 8-3. These are the colder phases during the heart of winter. But even if the MJO doesn't stay as active as I think.  The when MJO weakens, the odds greatly favor the notion that we would be in a cold phase when the MJO decides to go into the null phase. If this happens the winter would go into that holding pattern, which in this case would mean temperatures for the heart of winter ending up below to well below average for winter 2018-2019.    

Where we stand now as opposed to what my outlook released in October had to say:

Even though it has only been a little bit over a month. There have been some big changes in the SST setup.  The equatorial Pacific  looks much more El Nino like. The warm blob has expanded. and the Atlantic has cooled even more.

These are all very important. Sea Surface temperatures are what drives the weather pattern.  This is because the oceans cover 70% of the Earth's surface. The oceans absorb most of the Sun's energy, and holds 99.9% of the thermal energy available to the overall global system.  SST's help us figure out where the predominate troughs and ridges will setup as we move forward.  

The Changes in Global SST's is very interesting. Right now, November of 2014-2015 is looking very close to the overall look we're seeing right now.  For months 2002-2003 was running very close to the current pattern, but now it appears that 2014-2015 very well could move into first place, with 2oo2-2003 running right behind it.  Both of those winters were brutal here in the Northeast and Mid Atlantic. This would imply that a warm December into January could be in-store for us.  We're seeing seasonal temperatures right now, but as we saw in both of this analog winters, we will see the warmth fade as the MJO propagates eastward.  2014-2015 was also when we saw arctic incursions from the so called Polar Vortex.   

The Jet Streams:

When we transition from Fall to Winter, the northern jet stream becomes stronger. The increase in wind speed has a major affect on the placement of the polar jet, which in turn impacts the pattern. When the jet is displaced north in Canada, the Northeast and Mid Atlantic tend to see warmer temperatures and more precipitation.  But when the polar jet is weaker, farther south, and more amplified the Northeast and Mid Atlantic tend to see colder winters.

The developing El Nino will cause the southern subtropical jet to also be stronger than normal.  The developing pattern is going to favor an active southern jet. This will have big implications for the Northeast and Mid Atlantic states. 

 With the weak El Nino (most likely a Modoki El Nino) and the warm blob in the North Pacific, there is little doubt that we will see a persistent ridge in the West Pacific, which will extend over the Northwest CONUS and into West Canada. This will force Arctic air over Alaska, the Northwest Territories, and the Arctic southward toward the Northeast and Mid Atlantic region. 

So now what?


As I said I haven't changed my mind on what I think winter 2018-2019 hold. I've gone into a lot of detail on weak El Nino's, the Warm Blob, MJO and others that show how these things are linked to cold and stormy conditions in the East.
Based on the above factors the predominate 2018-2019 winter pattern should look close to this.

We've seen that the pattern that is in place is capable of delivering extreme cold.  If the arctic outbreak had occurred in December or January, we most likely would've seen temperatures 20-40 degrees lower than they were on Thanksgiving. The pattern is going to be very capable of delivering cold and snow this winter.  As I said on my Facebook Northeast Weather Page, I think the odds that many of us have a White Christmas this winter is good. 

The pattern is still reacting to the daily changes to the winter jet stream setup. so we're seeing daily variations in the overall pattern. But as things settle in, the pattern should turn the way I've been laying out of months.   The date I posted this was 11/30/2018 after an remarkably cold and snowy November, we're heading into a very brief warm up for the first weekend of December. But the cold comes back. Typically weak to moderate El Nino's  see at least some warming in December. The 4-10 day of December could see a couple of snowstorms, depending on temperatures.  Based on what is going on, I think we will see some warming around Midmonth  But then mid to end of January into March gets wild, with more in the way of cold and becoming very wintery. We should see persistent dips in the polar jet will lead to a active storm track. There is a good chance for seeing a split flow in the Jet, with an active southern half, with the northern half bringing cold. This would allow for southern storms and Coastal s.  This is why my snowfall map is showing heavy snow across the Virginia's and Carolina's    November going into December for the analog years of 1977,2002, and 2014 looked very similar to what is going on right now.  This winter will be overall quite cold with above average precipitation snow, mix, and rain.  Also as I've said before there will be a heightened risk this winter for a moderate to heavy ice storm or two for parts of the region.  Here are the temperature and snowfall maps I produced back in October. I have made no changes.
Temperature


Wintertime Precipitation.


That's it, I hope you found this enjoyable and educational. I will gladly answer any questions you may have.


Saturday, October 20, 2018

My official 2018 2019 winter outlook.


I started talking about this coming winter even before the summer.  I've directly and indirectly said I believe this winter will be quite cold and chilly. I said months ago that this winter most likely would be coming early and staying late. The success I had forecasting during this year's Atlantic hurricane season is the same pattern going forward. The Pacific and Atlantic tropical seasons will have an impact on winter 2018-2019. I've been trying to keep all y'all informed; I started posting my preliminary  thoughts on this winter back on August 7th. But even way before that I've posted about the evolving pattern and how that pattern related to this upcoming winter.   If you haven't read my preliminary winter thoughts, I encourage you to do so. Here are the links.


Those three part installments laid the ground work for this post.  We are now in the last part of October. So far everything I've been talking about  on my weather pages and in several blog post has come to past.  we are now quickly changing over the winter pattern; the cold has indeed arrived early.  Before I get started, first of all let me say for the umpteenth time , I think it will be a cold and snowy winter for much of the eastern half of the U.S.

But remember  I'm talking overall colder than average temperatures and above average snowfall for most of the Northeast and the Mid Atlantic. It won't be subzero all the time; as we see every winter there will be warm ups from time to time. Also remember wintertime precipitation is  sleet, freezing rain, snow, and sometimes even rain.  The pattern going forward will support all of these at some points over winter 2018-2019.

Last winter we saw a lot of variable conditions.  It started out cold, then got very cold from around Christmas into the first week of January.  Mid January into much of February we warmed to well above average. Then cooled back off for March into Much of April.  We also had five major nor'easters. One In January and four back to back in March. 

OK what about this winter:

The Northeast and Middle-Atlantic have turned very cold  by October standards.  As we get  into November the trough will adjust west and sit over the Plains.  Then it should adjust back east as we get into winter.

The models are moving toward the thoughts I've been laying out.  Even the CFSv2  (which normally has a hard time finding cold in any pattern) is coming around to the idea that the Northeast and Mid-Atlantic will be quite cold this winter.  The JMA and Euro are also adjusting to a very cold look for December through February.  The Euro weekly is showing a lot of cold for 2/3 of the CONUS over the next 46 days, the core of the cold looks to be over the Great Lakes, Midwest, and the Northeast.  This would absolutely play into the pattern I've been talking about for months.

Here is how the CFSv2 has been progressing.


The Euro 46 day overall temperature anomaly.


 Analog Years:

1958-1959 1968-1969, 1972-1973 1976-1977,1977-1978, 1986-1987, 1994-1995, 2002-2003, 2006-2007, 2009-2010, 2014-2015. 2002-03 is leading the pack at least for now.  If you remember back to 2002-03 that October acted very much like this one. Other years that are in the running are 1968-69, 1986-87, 1994-95, and 2009-10, 2014-2015.  When doing analogs we blend the years that had similar patterns; this is what the temperature outlook maps are based on. The maps show an overall blend of those analog years.  So during the winter, different aspects of those analog years will manifest themselves.   

Looking at the Sea Surface Temperature (SST) anomalies:

The Pacific:

     The El Nino Southern Oscillation (ENSO):

Winters  tend to be colder than average in the Central and Eastern US during El Nino Modoki, as opposed to an Eastern based normal El NIno which tends to be warmer in the Central and Eastern U.S.

The ENSO  region in the Pacific is heading toward a  weak to moderate  Modoki  (centrally based) El Nino in the tropical Pacific. The El Nino conditions are becoming more and more apparent.   Looking at the global SST pattern, the tropical Pacific has a very distinct El Nino look.  We can also see the colder SST near South America. Over the next several weeks we will see the ENSO evolve toward a Modoki even more.  The subsurface water temperatures  already show the El Nino Modoki footprint. The reason a Modoki leads to East Coast troughing has to do with how energy release forces a trough north of the center of the warm SST. If the heat is in the central Pacific then there will be a trough in the north central Pacific south of the Aleutians. This would cause a ridge east of the trough. This ridge would be over the West Coast. This in turn means a overall trough would be over the East Coast.  If the warm SST were in the eastern Pacific, the process would cause a trough over the West Coast and a Ridge over the East Coast. We saw this occur back in 2015.  


     The Eastern Pacific Oscillation:

When we have a Modoki El Nino, it improves the odds for a negative EPO. A negative EPO would allow the eastern Pacific to warm up, bringing some of this warmth to the west coast of North America.

     The Blob:

Warmer than normal water in the northern Pacific. The blob is looking quite extraordinary. The last time it looked similar to this was the winter of 2014-2015. A strong blob Is a good indication of West Coast Ridging setting up during winter 2018-2019.

      The Quasi-Biennial Oscillation (QBO):

The QBO has a direct correlation to winter weather patterns.

The QBO is east based but is trending west. But I think we will see the east based QBO hang around into February. This is important, when the QBO is in the eastern phase we tend to see more stratospheric warming events, especially when combined with low solar activity.   


      PDO:

The Pacific Decadal Oscillation (PDO), like all teleconnections it has a warm and cool phase. The PDO has a big impact on the strength of the ENSO. The PDO can intensify or diminish the impacts of the ENSO. A warm phase PDO will work hand in hand with an El Nino. A cold phase in the PDO will amplify the effects of La Nina. Conversely, if the PDO and ENSO are in opposite phases they act as a counter balance to each other.  Last fall we had a positive PDO that was trending negative.  Winter 2017-2018 featured a neutral trending  to a negative PDO.  The result was we had  a trough in the west and a stronger than average southeast ridge what causes all kinds of havoc with our winter temperatures.   

 The PDO is positive (This is the so called "warm blob" That sits just south of Alaska)  and that looks to continue into at least Spring of 2019. This would help promote the western ridge and an east trough. This would help ensure  below average temperatures in the Southeast, Mid Atlantic into the Northeast. This would also favor above average winter precipitation too.    

The Atlantic:

We have above average SST along the East Coast and Gulf of Mexico.  Those warm SST will help to lend support to any coastal storms that do develop.  With general  eastern troughing expected,  we should see chances for digging troughs to amplify and phase with the cold arctic air.  So there will be a chance for at least a few bigger Nor'easters.

Colder than average temperatures near Greenland.  The winter of 2014-2015 saw this area of the North Atlantic even colder than it is now.  Those on the global warming side of the isle say this cold blob is because the current and circulation patterns in the Atlantic are slowing.  But I think it is just because of climate variability.   

The Atlantic Oscillation (AO) and North Atlantic Oscillation (NAO) have been strongly positive for a long time.  But Hurricane Michael has forced a pattern change. Part of the change was warming in the stratosphere. As a result of that the AO and NAO have both tanked.  With the negative AO and NAO we now have blocking setting up. The blocking is leading to all that cold Canadian air to pour south into the U.S.  This kind of blocking pattern is exactly what one would expect from a east based QBO.  Those cold SST around Greenland is a good signal for a colder Northeast.

The  Indian Ocean:

The east  Indian Ocean is cooler than the west Indian Ocean and northeast of Australia.  This is important,  when we have that setup in the Indian Ocean and a El Nino we tend to see the MJO try to stay neutral or stay in the colder phases for the East Coast.  Phases 8,1, and 2.

The Madden-Julian Oscillation (MJO):

The factors above have an influence on the MJO.  The MJO will be what decides where the strongest convection will set up.  This in turn will affect how the Pacific jet behaves.  Last winter the MJO moved into warm phases 4,5, and 6. This caused the warmth we experienced for the end of January and February.  When we have a Modoki El Nino the MJO is typically able to push farther eastward do to the effect on air motion in the Central Pacific.  This leads to plenty of moisture for MJO caused convection.   A Modoki El Nino sees warm SST in the central Pacific with cooler SST east and west of there. Typically when we see colder SST in Indonesia we tend to see the MJO stay mostly or completely in the colder phases 8,1, and 2. This is another key showing we should have a colder winter.

Solar Cycle:

Low solar activity is a sign for cooler as opposed to warmer winter temperatures.  There is a weak correlation between solar activity and temperature.  The reason for this is most likely because when the Sun is quiet we have last solar radiation impacting the atmosphere. It has been noticed that when we have less solar radiation impacting the Earth, we have increased ozone levels in the Stratosphere. A warmer Stratosphere over the Arctic means the polar vortex is weaker, which makes it easier for pieces of the cold arctic air can break off and migrate south into the CONUS. It was Drew Shindell who first noticed the connection between ozone level and temperature. 

This season we have a very quiet Sun. So this supports my thoughts on a colder than average winter here in the Northeast.  

Snowpack and High Latitude Blocking:

Northern Hemisphere snowpack is valuable tool in trying to figure out if we will see high latitude blocking during the upcoming winter. This can help us gauge if the winter will be more inclined for cold shots.   Siberian snow cover is behind from where it was last year at this time. could this throw a monkey wrench into my outlook...maybe.  But on the other hand,  the area where the snow is located is more important than the extent of coverage.  When looking at Eurasia we're concerned if there is snow below 60 N;  There has been  expanding  snow in that part of Siberia.  So based on Eurasia snow cover, there is weak signal for high latitude blocking.   The Canadian and Greenland Snowpack are well above average for this time of year.  There has also been snow in the Rockies, this is ahead of last year.  Snowpack is a very important factor; the more snow the more modification the air masses will experience over the winter  as they drop south.


There is a correlation between years that have low solar activity and blocking near Greenland.  All of this is a good indicator that we should see above average chances for blocking this winter.

There is a correlation between tropical activity and East Coast winter temperatures.  Strong October Gulf Hurricanes tend to precede cold East Coast winters.  Another interesting tidbit, is years that saw a Pacific tropical cyclone impact the desert Southwest also lead to cold East Coast winters.  This year we saw two do this.

The bottom line:

Summer into Fall 2018 has been acting very El Nino Modoki like.

Temperature:

I have strong confidence that I'm right on the developing pattern.  All of the factors I went over work to influence the Idea of an East Coast Trough, with the higher probability for Greenland Blocking, I think this will be a fairly cold winter. Here is a look at both my thoughts on winter temperatures across the CONUS and for the Northeast and Middle-Atlantic.

We have to expect the trough over the east right now, will relax and pull west for part of  December, maybe even into the start of January. But any warmth for December/January shouldn't be a blowtorch. The warming could last two to four weeks. During this time, we would see more in the way of  temperatures  slightly above average to above average. November will still most likely end up being overall below average. The cold that is available could overwhelm the pattern, making for some periods of near record to record breaking cold.  December most likely will be warm. But the seasonal temperatures should come back around Christmas.  The first week or two of January could be warmer than average. Then the bottom could fall out, with things becoming very cold. The analog years I've latched onto would support that Idea. But I think ,  the rest of January, February , and into March look pretty overall cold based on the analogs and the pattern that has been with us all year.  The Models are trending colder, this is a good sign that I'm on the right track for this upcoming December through February timeframe.  


Winter Precipitation:

Winters that feature an El Nino Modoki tend to see more of an active southern jet stream.  An active southern branch increases the likelihood of East Coast winter storms. ... more snow storms....more snow.  This is why I have the Middle-Atlantic into the Southeast with well above average snowfall for this winter.  There is also the risk for a few ice storms this winter. The Ice storm risk will be greatest in the Southeast; but, I can't rule out the possibility of an ice storm in the Northeast.  I'm thinking this winter will see slightly below average to average lake effect snow in the snow belts . But lake snow is volatile so trying to forecast the entire Lake Effect season is almost impossible.  But based on the analogs, I think my Lake effect idea has merit.   


If something happens that changes my mind on some of this; I will post an update on the temperature and precipitation pattern for this winter around mid November.

Images courtesy of WeatherBell Analytics, Tropical Tidbits, National Oceanic and Atmospheric Administration, National Solar Observatory.