
Surface analysis and upper air charts.
| Surface Analysis Animation |
|---|
Current US Surface Chart
250mb Chart
500mb Chart
850mb Chart
925mb Chart
CAPE Chart
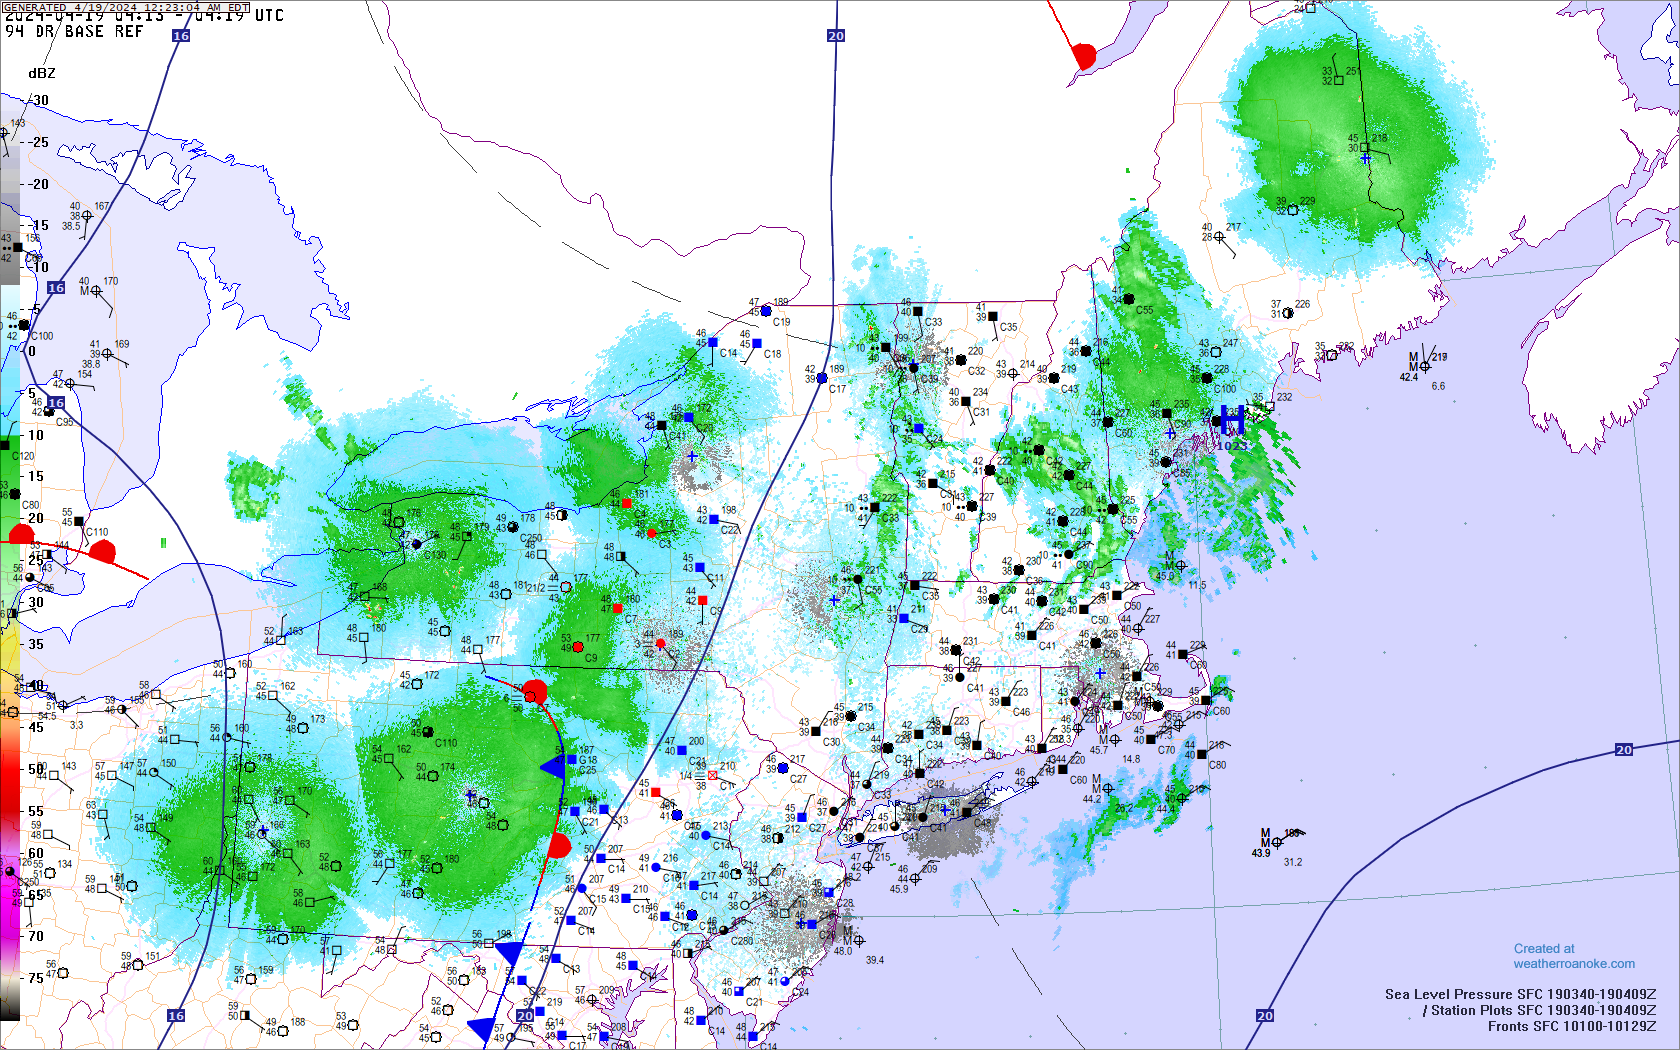
Current Northeast frontal positions
Surface Low Track Forecast
Current Storm Relative Helicity/Storm Motion Analysis
North America Surface Chart
Northeast Surface Chart
U.S. Surface Analysis
Northeast Surface Analysis Loop.
| Surface Analysis Animation |
|---|
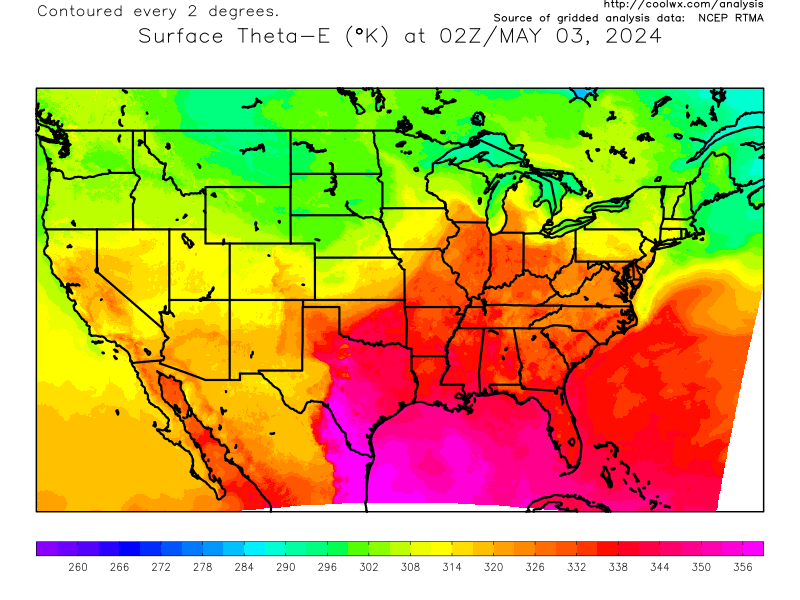
Surface potential temperature map of US
| Current 850mb Upper Air Chart | Current 700mb Upper Air Chart | Current 500mb Upper Air Chart |
 |
 |
 |
| Current 300mb Upper Air Chart | Current 250mb Upper Air Chart | Current 200mb Upper Air Chart |
 |
|
 |
| Surface temperature Potential | Surface Mixing Ratio | Northeast Surface Chart |
 |
 |
 |
| Northeast US 2 Hour Pressure Change | Northeast Near Freezing Surface Temperatures | Northeast Critical Thickness Analysis |
 |
 |
 |
| Current Northeast US Mesoscale Analysis | Current US Surface Theta-E Chart | 500 mb Overlayed On Water Vapor Satellite Image: |
 |
 |
 |
Web Policies & Notices
I wish I could understand these charts
ReplyDeleteI've posted a few blogs on this subject..If you read them they will shine a little light on the subject.
DeleteI tried reading those blogs. Kinda hard for someone like me to understand.
ReplyDeleteMeteorologist look at different layers of the Troposphere The 200 to 300 mb level is where the Jet stream resides. watching this level can tell you how strong storms might become. Each layer has a story to tell... for example the 850mb map is very important in knowing how much moisture is available for precipitation. Whereas, the 500mb level is the middle of the atmosphere. The low pressure systems you see on TV weather . are easily seen at this level.
Delete