
What is Space weather?
It describes the interaction between the Sun and conditions in space that affect Earth . Storms on the Sun can produce bursts of charged particles. These shoot out into space, and sometimes end up hitting the Earth. Space weather phenomena include the Northern lights and solar radiation storms. Sometimes these bursts of charged particles can effect technological systems.
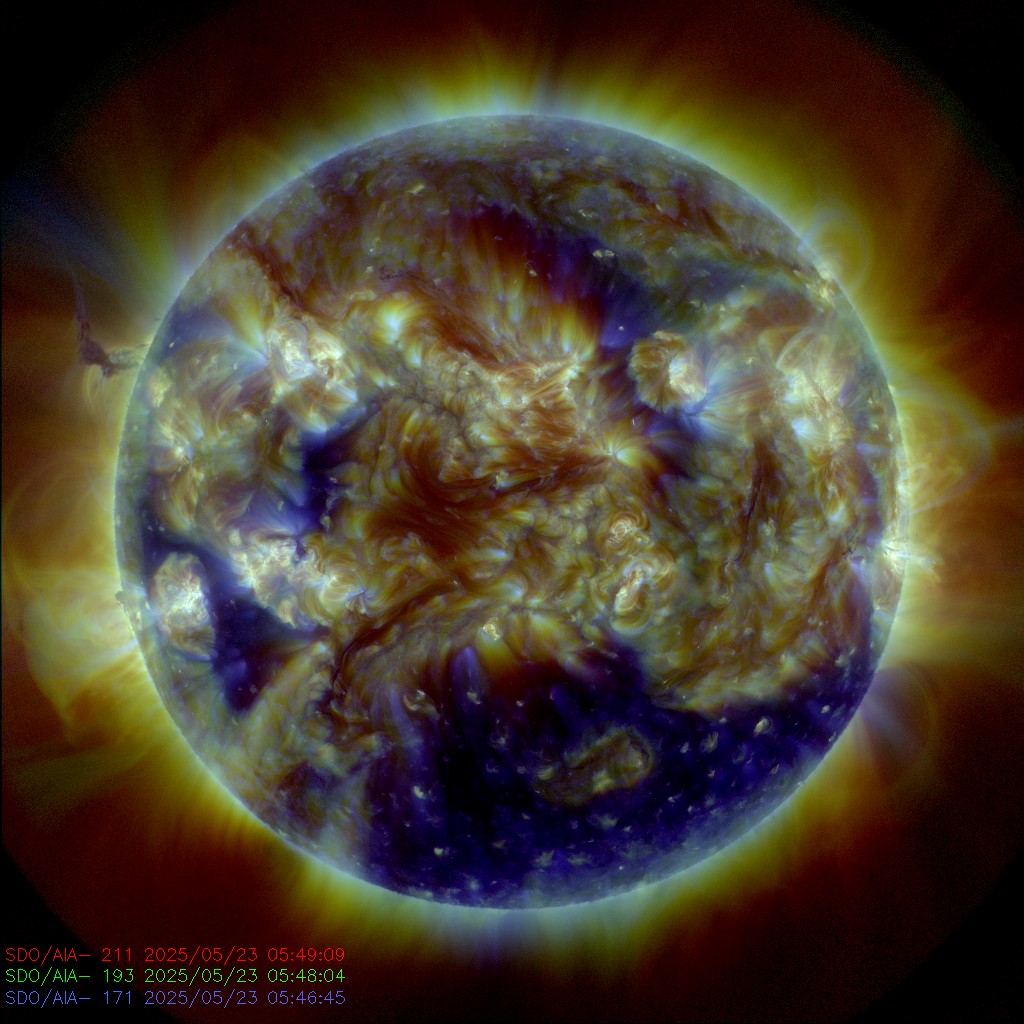
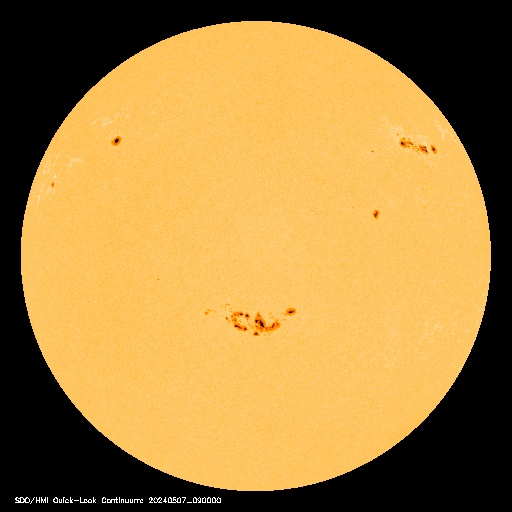
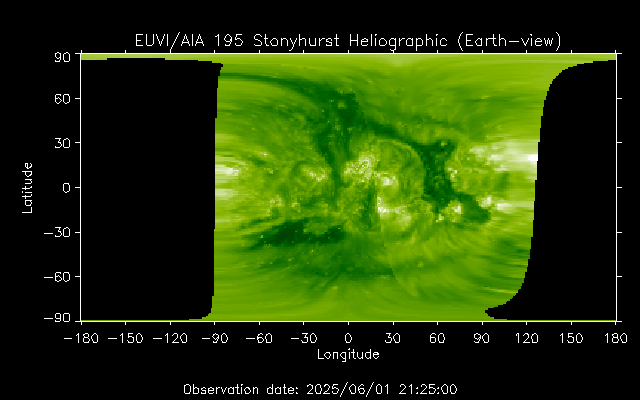
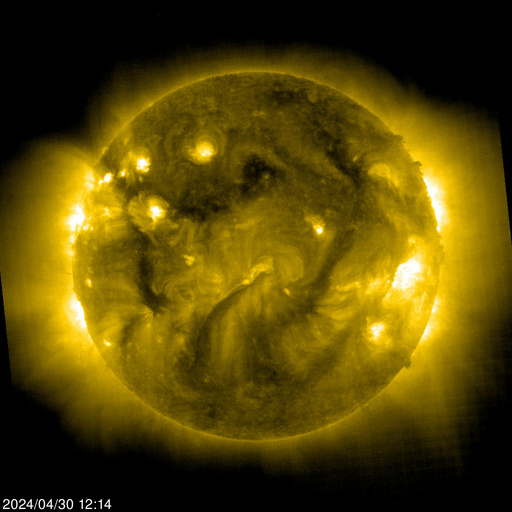
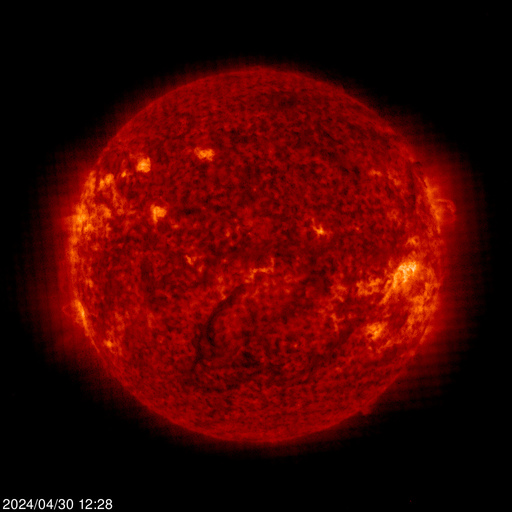
| Latest AIA 211 Å, 193 Å, 171 Å Image | Latest SDO/HMI Continuum Image | STEREO Rotating 0 DEGREE FACING EARTH |
 |
 |
 |
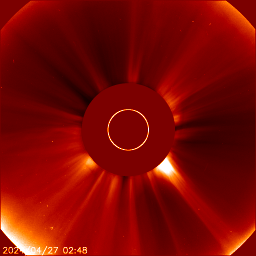
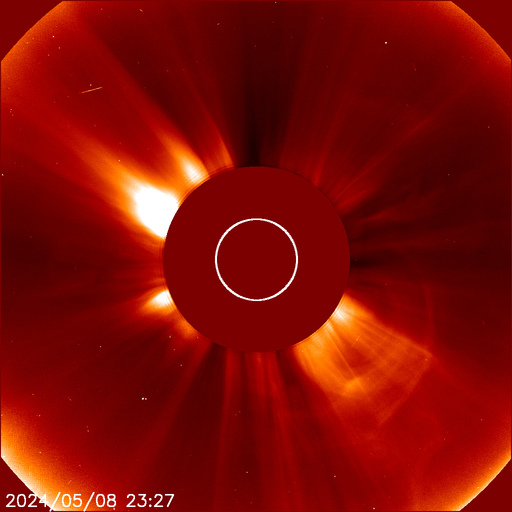
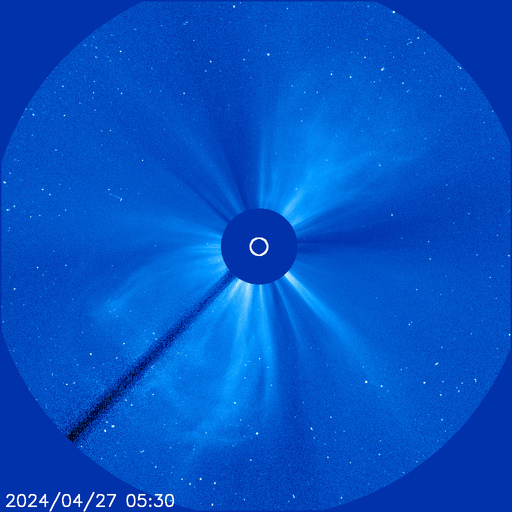
| SOHO LASCO C2 over last few days | Latest SOHO LASCO C2 Image | Latest SOHO LASCO C3 |
 |
 |
 |
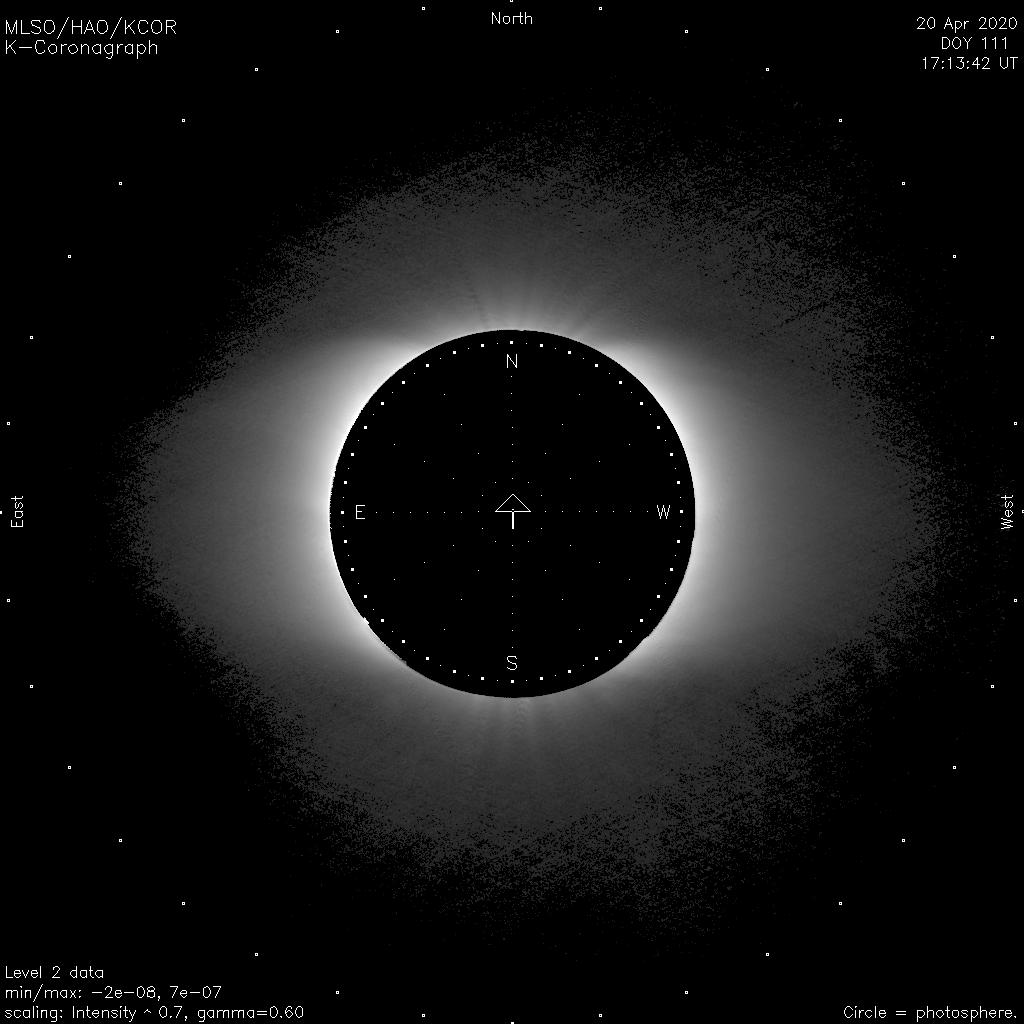
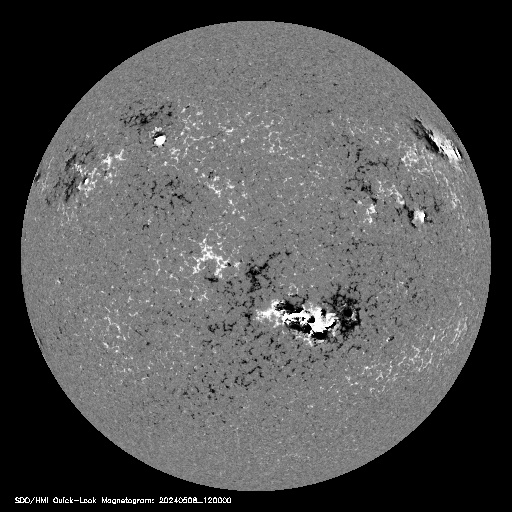
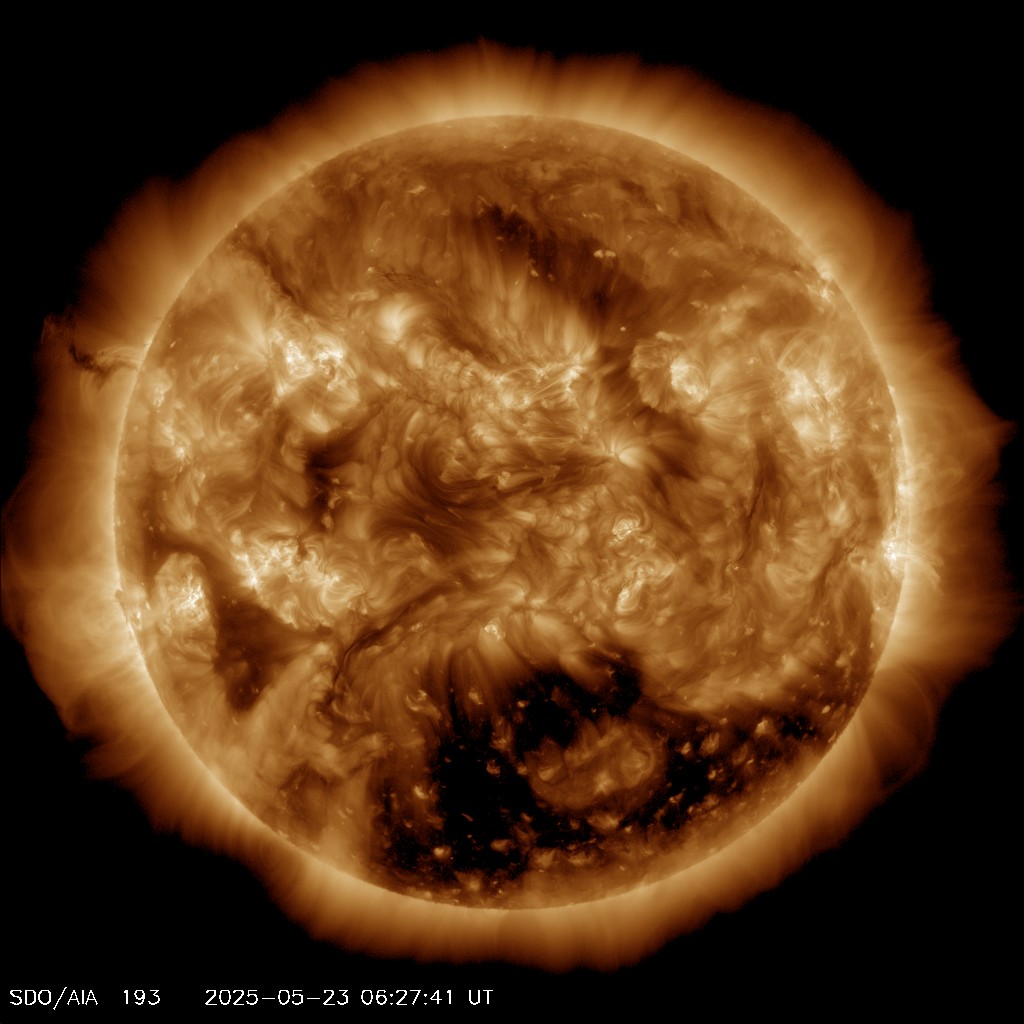
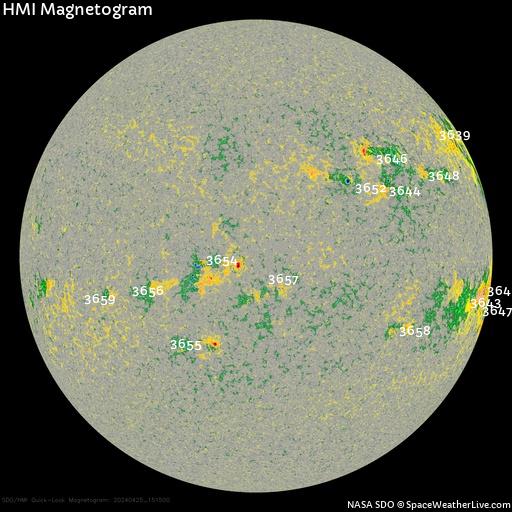
| Latest Coronagraph Image | SDO/HMI Magnetogram | AIA 193 |
 |
 |
 |
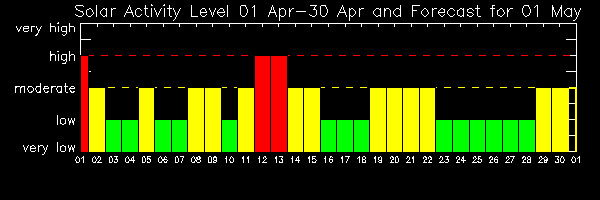
Solar Activity
NOAA,Space Weather Alerts and Warnings text
Text message about space weather Alerts and Warnings.
Current Global foF2 Frequency Map
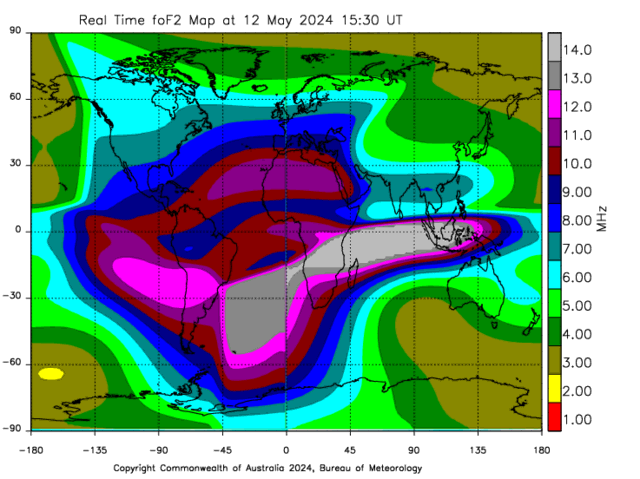
The plot above shows a near real-time critical ionospheric frequency (foF2) map produced using automatically scaled ionogram profiles from the Australian region and around the world.
The map shows colour contours of foF2 in units of MHz.
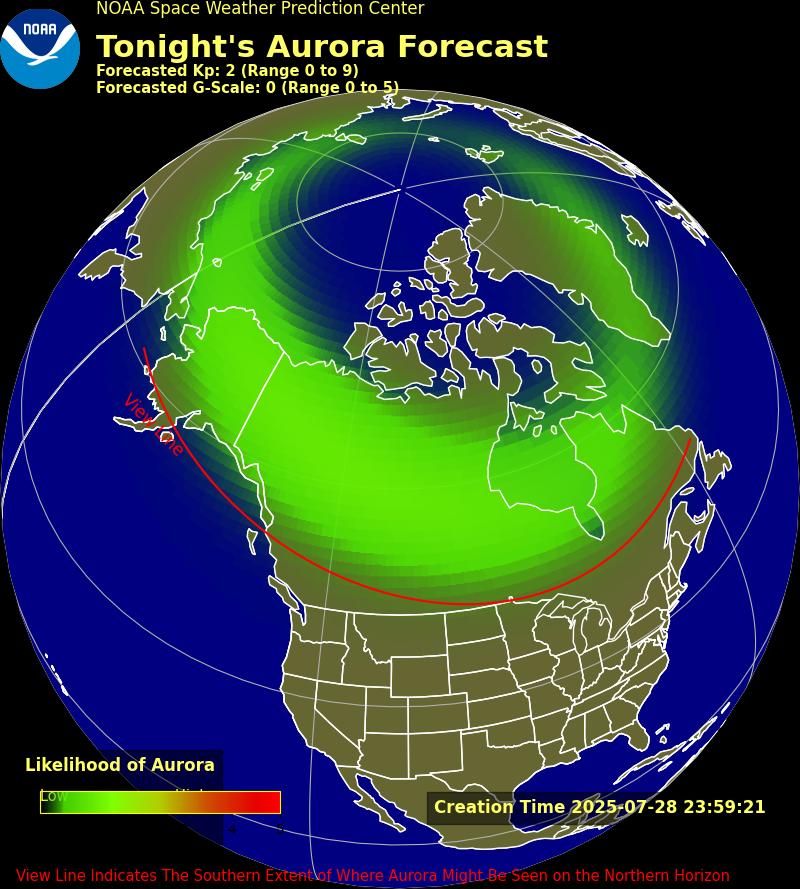
North American Auroral Forecast.
Predicted Geomagnetic Activity Indices (Kp, Dst and AE Proxies) Predicted indices shown needs to be compared to the map below. The vertical green lines indicate the most recent value. Kp=0 means a very quiet period while Kp=9 means extremely severe activity.
Station K Indices
find the Kp number line on one of the following maps that matches the Kp number predicted above. If you are located at or above the estimated Kp line, you are in the right spot. You might even be in luck if you are located within next lower line, but you will have to look lower on the horizon. Be aware though, ground based light pollution and weather will have a greater impact at these more marginal locations.
Real time solar wind data 2 hour forecast.
Real time solar wind data 6 hour forecast.
Real time solar wind data 24 hour forecast.

Real time solar wind data 3 day forecast.
Real time solar wind data 7 day forecast.
NOAA, Space Weather Alerts and Warnings notification timeline
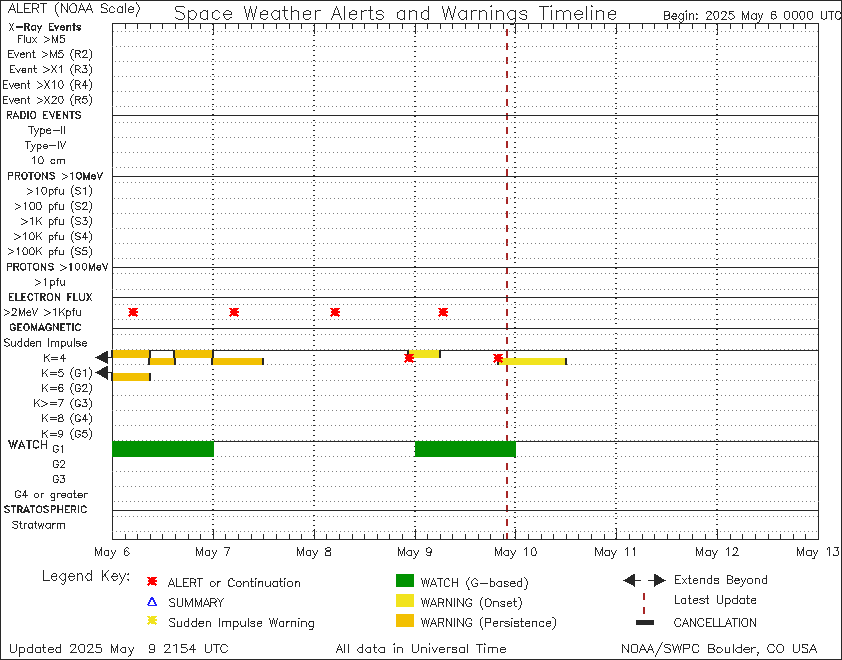
Warnings Currently in Effect, 7 day plot centered on today showing past 3 days and next 3 days.
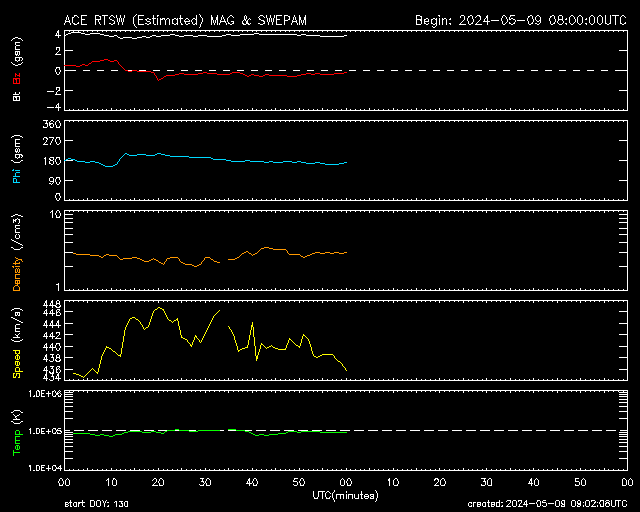
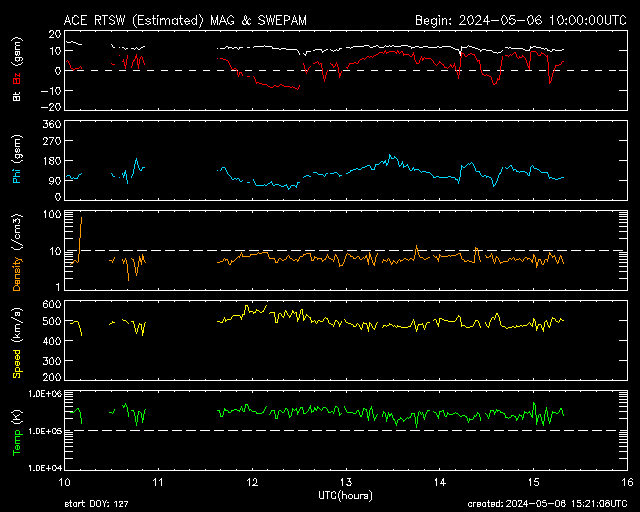
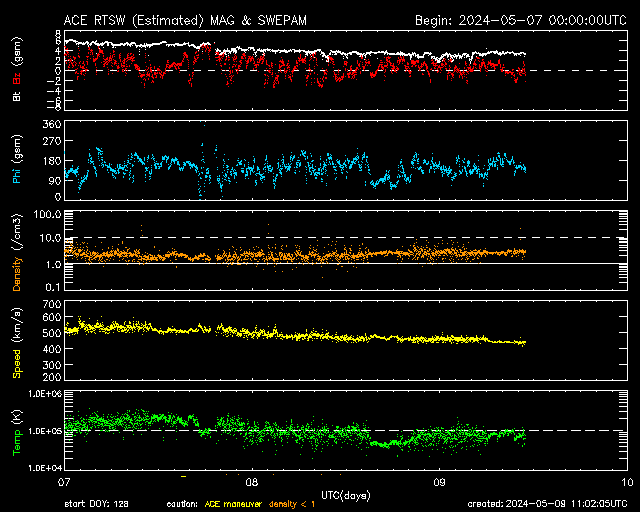
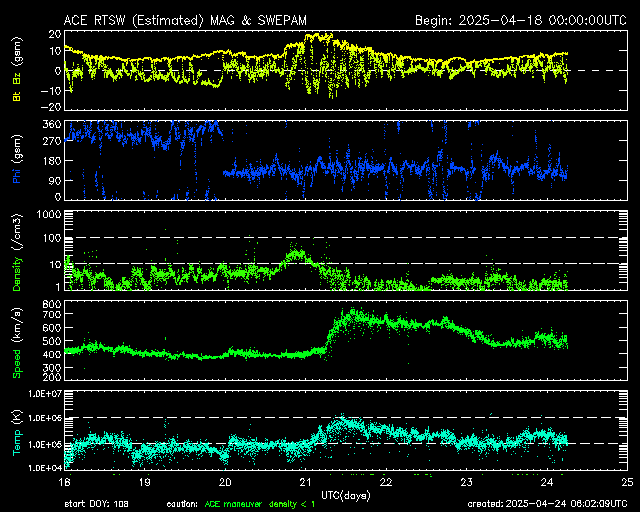
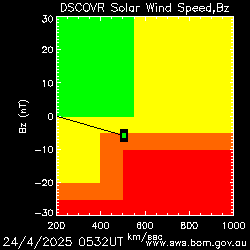
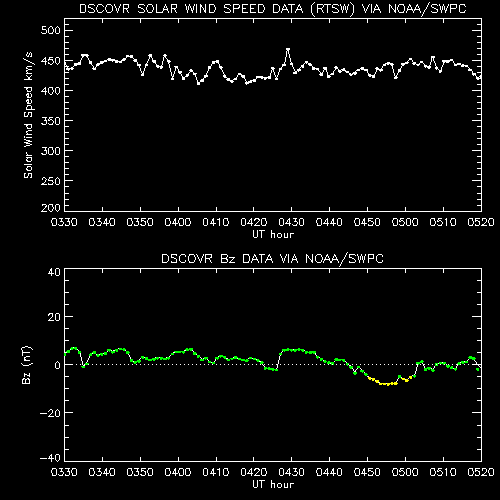
The latest solar wind data.
Click on an image for a larger view.
| Watching The Far Side | Solar System and Planet Positions live |
|---|---|
 |  |
| Click image above for current data | Click image above for current view |
| Solar and electromagnetic spectrum | Current inner solar system positions | Current sunspot data |
 |
 |
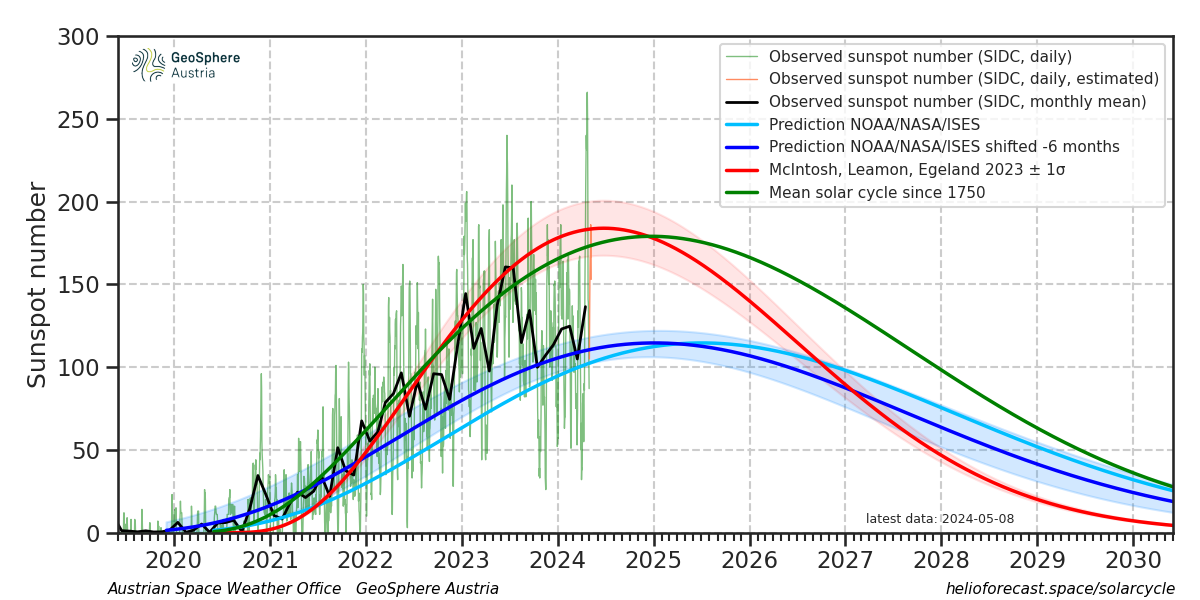
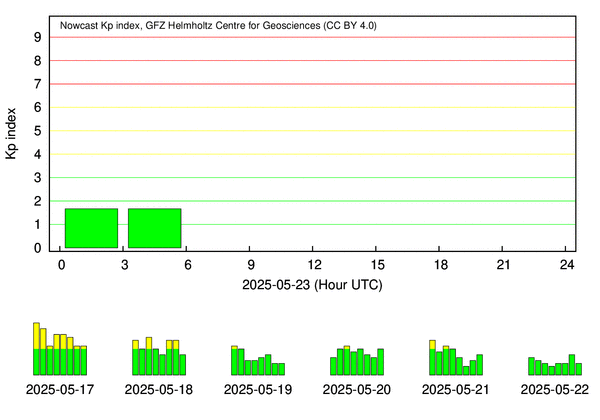
Solar Cycle Data
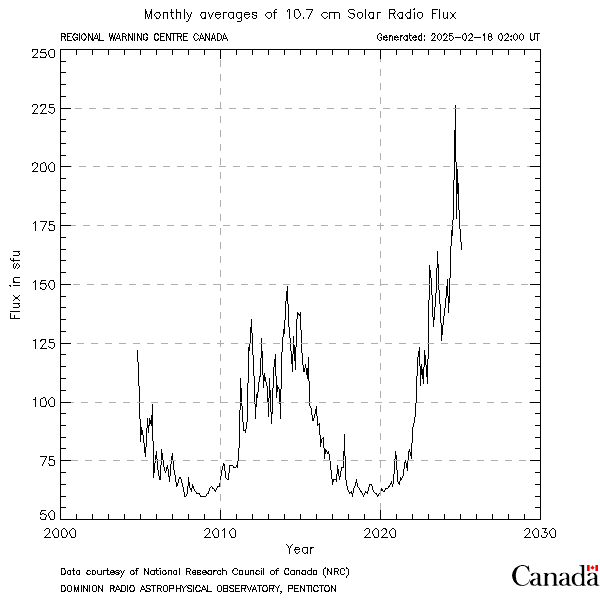
| Sunspot Number Progression | Radio Flux | Nowcast Kp Index |
 |
 |
 |
The Space Environments Team in the Natural Environments Branch of the Engineering Directorate at Marshall Space Flight Center (MSFC) provides solar cycle predictions for NASA engineering programs and the aerospace community. The purpose of the predictions is to provide future statistical estimates of sunspot number, solar radio 10.7 cm flux (F10.7), and the geomagnetic planetary index, Ap, for input to various space environment models. For example, the F10.7 and Ap are required inputs to upper atmosphere (thermosphere) density computer models used for spacecraft operations such as orbital lifetime analysis and for the planning of future spacecraft missions.
Each month the solar prediction is updated using historical and the latest month's observed solar indices to provide estimates for the balance of the current solar cycle and the next. The forecasted solar indices represent the 13-month smoothed values consisting of a best estimate value stated as a 50 percentile value along with the 95 and 5 percentile statistical values. The F10.7 prediction also includes a 75 percentile value.
The estimation technique is used to predict the remaining of the current cycle, but it is not able to predict the next solar cycle at this time. However, for engineering applications and mission planning an extended forecast for the next solar cycle is given below. The values shown for the next cycle are those of a mean cycle obtained from averaging previous cycles of 13-month smoothed indices along with the calculated statistical bounds.
More Solar Images
| SOHO EIT 171 | SOHO EIT 284 | SOHO EIT 304 |
 |
 |
 |
| HMI Magnetogram | STEREO Behind | STEREO Ahead |
 |
 |
 |
Click on an image for a larger view.
| Monthly Averaged Radio Flux | Global D-Region Absorption Updates every minute | Latest CME Data |
 |
 |
 |
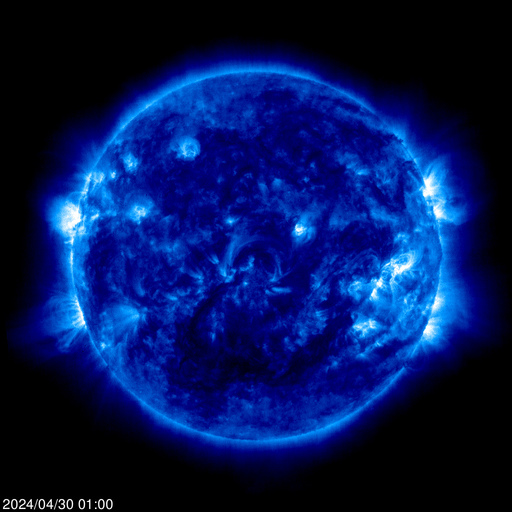
The Solar Aspect Monitor (SAM) is a pinhole camera that is sensitive to X-rays. This channel is a lower resolution image of the Sun in the wavelength range from 0.1-7nm. Because this is a large wavelength range, there are many different emissions from ions as well as continuum emissions within this band. This image clearly shows where active regions and flares occur. In the second image the large white square is the peak location, and the diamond is the centroid.
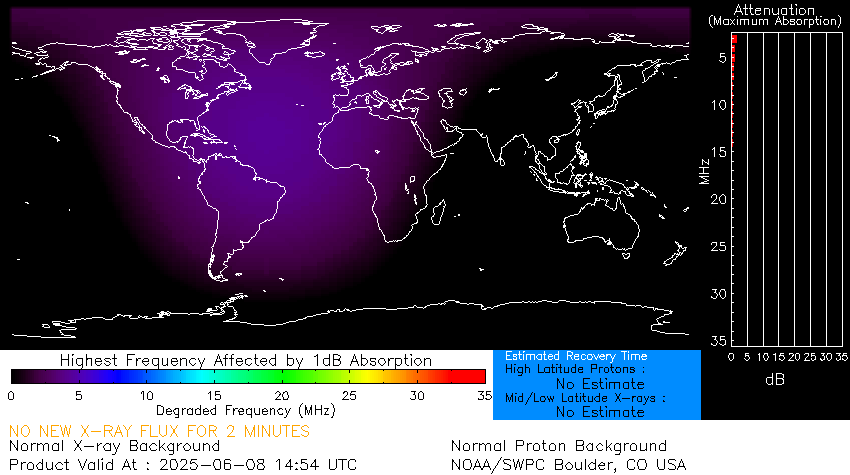
Conditions in the D region of the ionosphere have a dramatic effect on high frequency (HF) communications and low frequency (LF) navigation systems. The global D Region Absorption Predictions (D-RAP) depicts the D region at high latitudes where it is driven by particles as well as low latitudes, where photons cause the prompt changes.
The D-Region Absorption Prediction model is used as guidance to understand the HF radio degradation and blackouts this can cause
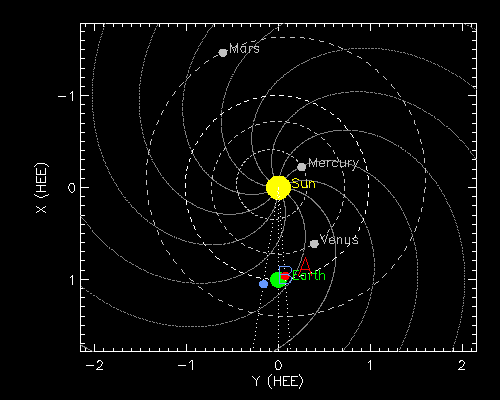
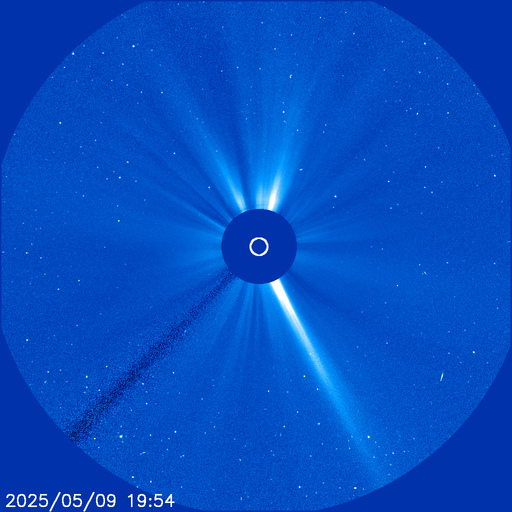
The CME Prediction Model on the right is released by Goddard Space Flight Center. it's used for forecasting Coronal Mass Ejection (CME). The model shows the ecliptic plane with the current positions of the four inner planets, and the position of the solar satellites.
| Solar X-ray Flux | ACE 2 Hour Plot | Solar wind: magnetic field and plasma |
 |
 |
 |
The Solar X-ray Flux plot (above left) contains 5 minute averages of solar X-ray output in the 1-8 Angstrom (0.1-0.8 nm) and 0.5-4.0 Angstrom (0.05-0.4 nm) passbands. Data from the SWPC Primary and Secondary GOES X-ray satellites are shown. Some data dropouts from the Primary satellite will occur during satellite eclipses.
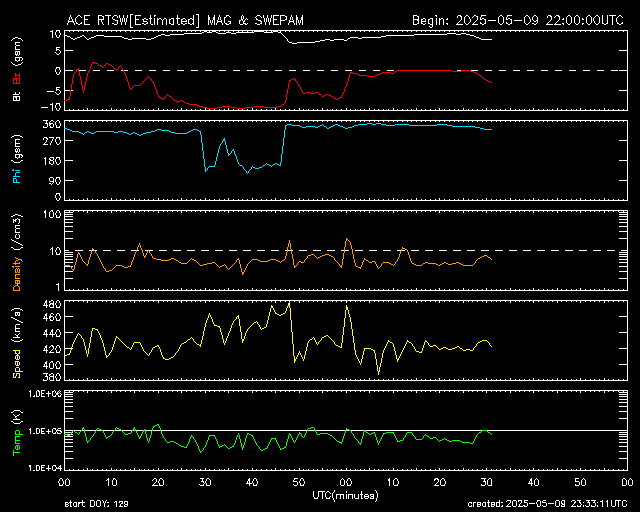
The ACE 2 Hour Plot (above center) deals with Magnetic field and Plasma data. It's updated every 10 minutes
ACE satellite performs measurements over a wide range of energy and nuclear mass, under all solar wind flow conditions and during both large and small particle events including solar flares. It provides near-real-time solar wind information over short time periods. ACE can also provide an advance warning (up to 60 minutes) of geomagnetic storms that can overload power grids, disrupt communications on Earth, and present a hazard to astronauts. .
| Real-time solar wind data | GOES 1-8 Angstrom Xray flux | GOES proton flux |
 |
 |
 |
Real-Time Solar Wind data dials (above left) is real-time Solar Wind data broadcast from NASA's ACE satellite.
High energy protons penetrate the Earth's magnetic field in the polar regions, crash into atmospheric particles and produce ion and electron pairs that temporarily increase the density in the lowest regions of the ionosphere. This causes absorption of short wave radio signals and wide-spread blackout of communications, called a polar cap absorption event.
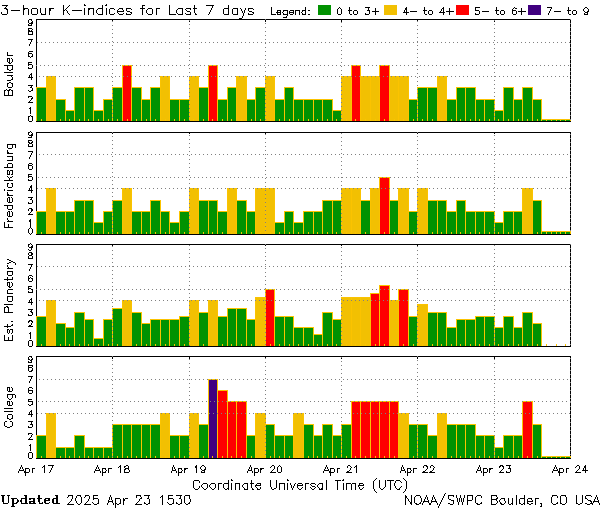
| Estimated 3-hour Planetary Kp (3-hour data) | Kp last 4 days plot | one minute Planetary Kp index |
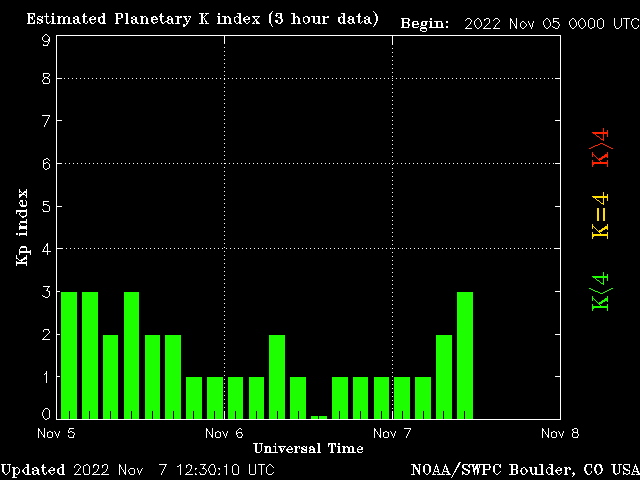 |
Geomagnetic disturbances can be monitored by ground-based magnetic observatories. The K-index is a code that is related to the maximum fluctuations of horizontal components observed on a magnetometer relative to a quiet day. The K-index is updated every three hours and the information is made available to Y'all as soon as possible. The K-index scale has a range from 0 to 9 and is directly related to the maximum amount of fluctuation (relative to a quiet day) in the geomagnetic field over a three-hour interval.
The Estimated 3-hour Planetary Kp-index (above left) is derived at the NOAA Space Weather Prediction Center using data from the following ground-based magnetometers: Boulder, Colorado; Chambon la Foret, France; Fredericksburg, Virginia; Fresno, California; Hartland, UK; Newport, Washington; Sitka, Alaska. These data are made available thanks to the cooperative efforts between SWPC and data providers around the world, which currently includes the U.S. Geological Survey, the British Geological Survey, and the Institut de Physique du Globe de Paris.
The KP 12 hour plot, the dashed red line indicates the lowest alert level, G1 (minor), on the NOAA Space Weather Scale. The solid blue line is the Estimated Kp index. The bottom Lead Time panel shows an estimate of the actual lead time which depends on solar wind speed. The lead time is the time for the solar wind to propagate from the ACE satellite, at L1, to the Earth. Missing Kp values, Lead Time values, or model output indicates the data is not available at SWPC. .
This electron flux plot (above right) contains the 5-minute averaged integral electron flux (electrons/cm2-s-sr) with energies greater than or equal to 0.8 MeV and greater than or equal to 2 MeV at GOES-13 (W75). These data are invalid during a significant proton event because of sensor contamination at the GOES spacecraft. Enhanced fluxes of electrons for an extended period of time have been associated with deep dielectric charging anomalies.
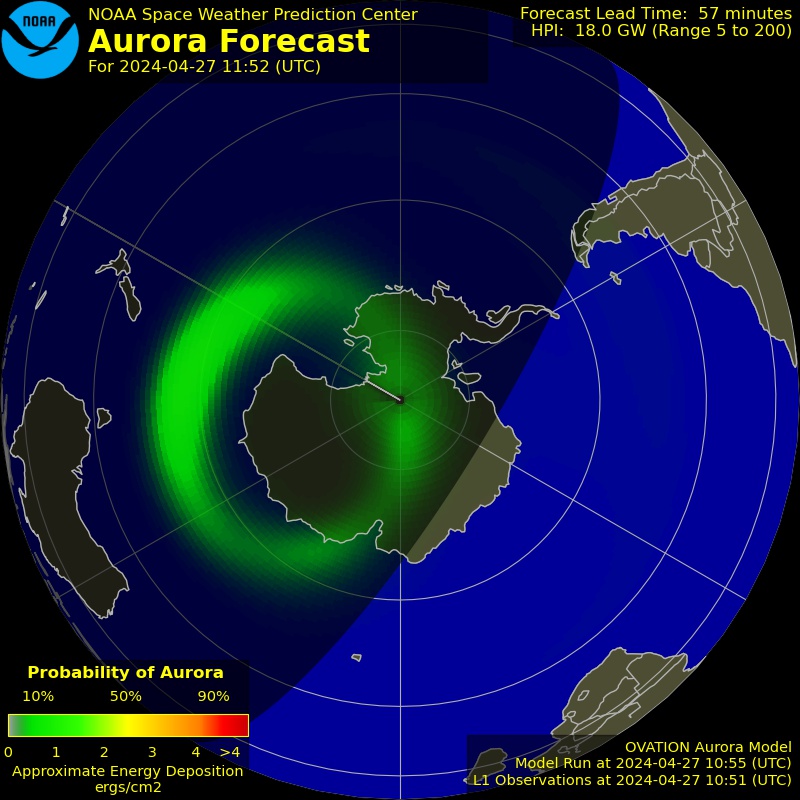
| Northern hemisphere Aurora forecast | Southern hemisphere Aurora forecast | Southern hemisphere D-region absorption |
 |
 |
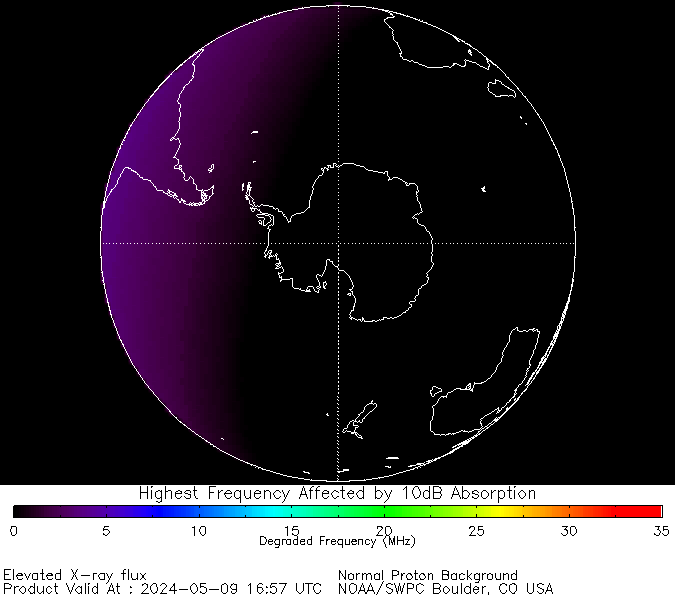 |
The Southern hemisphere D Region Absorption Predictions(above right) Conditions in the D region of the ionosphere have a dramatic effect on high frequency (HF) communications and low frequency (LF) navigation systems. The global D Region Absorption Predictions (D-RAP) depicts the D region at high latitudes where it is driven by particles as well as low latitudes, where photons cause the prompt changes. .
The left and center maps are generated by OVATION Prime - a new-generation precipitation model (Newell et al., 2010) driven by an optimized solar wind coupling function (Newell et al., 2007). The model includes seasonal variation and separates different types of auroras - mono-energetic, wave, diffuse and ion. In these maps all types are summed together - Electrons + Ions: 10Re above Earth..
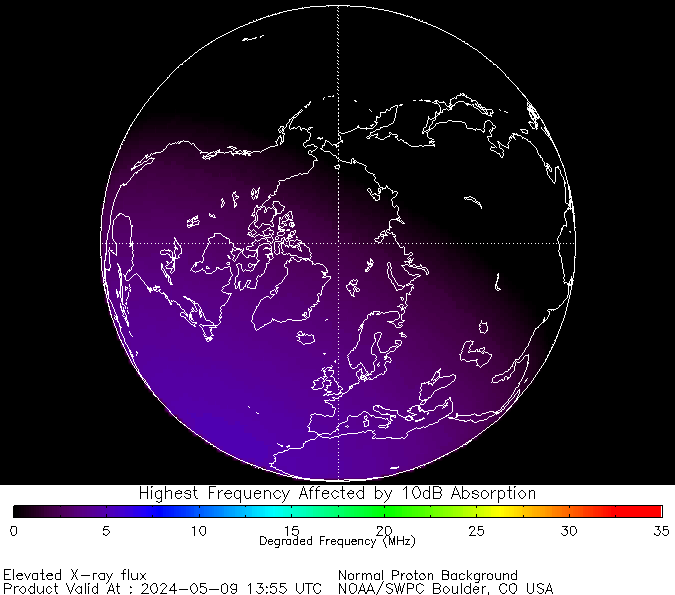
| Northern hemisphere D-region absorption | Geomagnetic Field | Solar X-rays |
 |
 |
 |
The Northern hemisphere D-region(Above left) D Region Absorption Predictions(above right) Conditions in the D region of the ionosphere have a dramatic effect on high frequency (HF) communications and low frequency (LF) navigation systems. The global D Region Absorption Predictions (D-RAP) depicts the D region at high latitudes where it is driven by particles as well as low latitudes, where photons cause the prompt changes.
The Geomagnetic Field status monitor (Above center) downloads data periodically from the NOAA Space Environment Center FTP server. The previous 24 hours of 3 hour Planetary Kp Index data is analyzed and an appropriate level of activity for the past 24 hours is assigned as follows:
Quiet: the Geomagnetic Field is quiet (Kp < 4).
Active: the Geomagnetic Field has been unsettled (Kp=4).
Storm: A Geomagnetic Storm has occurred (Kp>4).
The X-ray Solar status monitor (Above right) downloads data periodically from the NOAA Space Environment Center FTP server. The previous 24 hours of 5 minute Long-wavelength X-ray data from each satellite (GOES 8 and GOES 10) is analyzed, and an appropriate level of activity for the past 24 hours is assigned as follows:
Normal: Solar X-ray flux is quiet (< 1.00e-6 W/m^2).
Active: Solar X-ray flux is active (>= 1.00e-6 W/m^2).
M Class Flare: An M Class flare has occurred (X-ray flux >= 1.00e-5 W/m^2).
X Class Flare: An X Class flare has occurred (X-ray flux >= 1.00e-4 W/m^2).
Mega Flare: An unprecedented X-ray event has occurred (X-ray flux >= 1.00e-3 W/m^2).
The designation "Mega Flare" was chosen by Kevin Loch when the status monitor was created on March 4, 1999. There is no "official" designation for flares in this range .
Solar Data Updates every 10 minutes | ||
|---|---|---|
| Solar Wind Speed | recent trends in solar wind speed | Solar Activity Plot |
|
 |
 |
The plots show the current status of some of the most used wireless systems. Their approximate degradation is calculated using the current solar flux intensity and factors such as typical link margins and signal-to-noise ratios, specific to each system
The GPS is on a Frequency: 1.575GHz.
The WCDMA (3G/UMTS)Frequency: 2.2140GHz
The WLAN(WiFi/802.11b,g)Frequency: 2.4GHz..
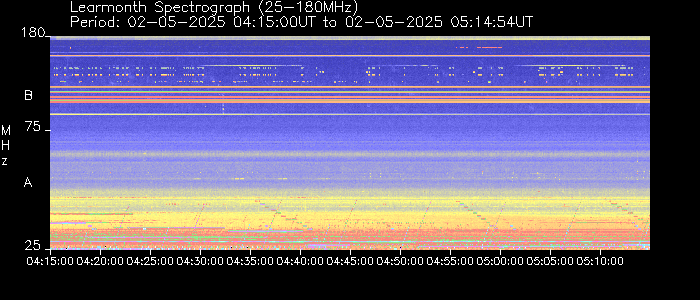
| Real Time Spectrograph | Activity forecast, 1 hour | 1 hr Predictions |
 |
 |
.getTime()}) |
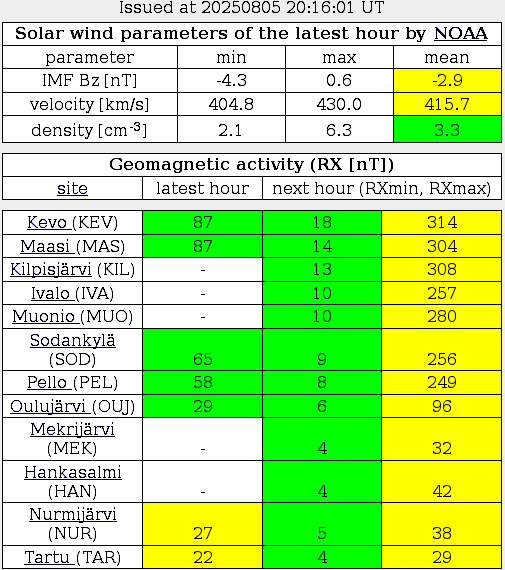
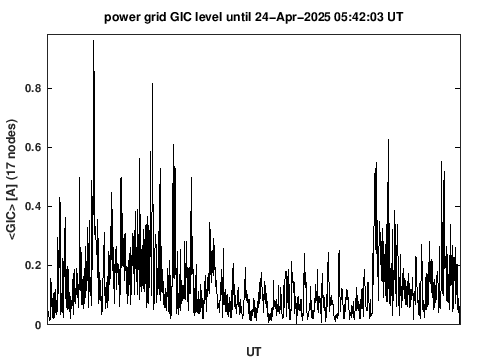
| Modelled GIC | Solar wind | interplanetary solar wind |
 |
.getTime()}) |
.getTime()}) |
| Boyle Index | 1 hr Predicted Geomagnetic Activity Indices | 3 hr Predicted Geomagnetic Activity Indices |
.getTime()}) |
.getTime()}) |
.getTime()}) |
Predicted geomagnetic Activity.
Predicted geomagnetic Activity indices shown above are derived solely based on the solar wind data using models developed through Artificial Neural Networks using the Boyle Index as a base function. Kp=0 means a very quiet period while Kp=9 means extremely severe activity. The graphs appear "fuzzy" because each time is a superposition of forecasts.
Each 15 minutes, the one-hour forecast is generated, to cover that 15 minutes and the succeeding 45 minutes. So the 1-hour prediction is always at least 45 minutes, and sometimes over 3 hours, ahead of the latest realtime Kp estimate from NOAA. We make each 15-minute prediction somewhat transparent so that you can observe the intrinsic variability in the forecasts. In a similar way, the 3-hour forecasts are shown overlapping. Every 15 minutes we make a new 3-hour-average forecast that covers the previous 30 minutes and the upcoming 2.5 hours. Thus the 3-hour averages are always more smooth than the one-hour average predictions but extend farther into the future.
Current Position Of The ISS.
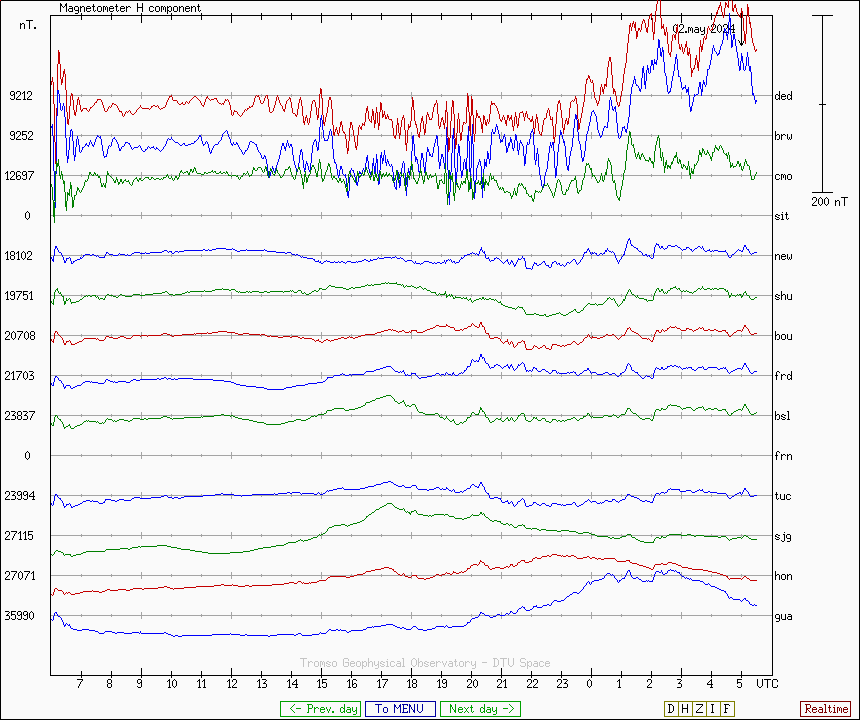
Magnetometer North America.
News and Information from SpacewWeather.com.
3 Day Forecast.
3 Day Geomagnetic Forecast.
sky conditions from my father's private observatory in northern New York.

| American Meteor Society |
|---|
Web Policies & Notices
Great share! , i Request you to write more blogs like this Data Science Online course Hyderabad
ReplyDeleteThanks for sharing your article. I really enjoyed it! new slot sites with a free sign up bonus UK
ReplyDeleteThank you for your awesome article. These types of article will be motivate other person Best online slots sites UK
ReplyDeleteIt is very useful Post keeps on sharing new things about fluffy favourites slot games
ReplyDeleteReally enjoyed this blog post. Really thank you! Best Online Bingo Sites UK 2019
ReplyDeleteOnline casino is not one of the place where a gamer can enjoy and entertain,you can also earn real money online.Delicious slots is used to promote your sites. Please check top UK online slots bonus offers
ReplyDeleteOnline casino is one of the place, Where a gamer can know each and every thing about casino.Your article is just like mention...If you want know more click on new mobile slot sites UK
ReplyDeleteGambling is one of the place where a gamer can enjoy and earn real money. Through the help of delicious slots know more click on free slot games win real money
ReplyDeleteYour tips are amazing! but i fonud something unique here, you should check these link out! bingo sites uk
ReplyDeleteYour blog is really cool and this is a great inspiring article. Thank you so much. No Deposit Bingo Sites UK 2019
ReplyDeleteThis comment has been removed by a blog administrator.
ReplyDeleteThis comment has been removed by a blog administrator.
ReplyDeleteYour tips are amazing! heart casino
ReplyDeleteThis comment has been removed by a blog administrator.
ReplyDeleteThanks for sharing your article. I really enjoyed it! Avianca Airlines Reservations
ReplyDeleteThis comment has been removed by a blog administrator.
ReplyDeleteHi Rebecca,
ReplyDeleteI really enjoy this blog. Do you ever broadcast weather, or do you have any audio recordings? I would love to listen in my car.
This comment has been removed by a blog administrator.
ReplyDeleteThis comment has been removed by a blog administrator.
ReplyDeleteThis comment has been removed by a blog administrator.
ReplyDeleteThis comment has been removed by a blog administrator.
ReplyDeleteThis comment has been removed by a blog administrator.
ReplyDeleteThis comment has been removed by a blog administrator.
ReplyDeleteThis comment has been removed by a blog administrator.
ReplyDeleteFUN88 website is an online gambling website that is
ReplyDeletelicensed to provide legal betting services from the
The Philippines by fun88royal.com.FUN88
ROYAL online gambling website Baccarat free credit
100 baht with up to 6 organizers, hot gambling
websites of the year 2021 Mobile Support Deposit
a minimum bet of 200 baht.
FUN88 Royal, We are an online casino service provider. It is a website that
supports entrance services and other services, which
is a direct website, not through an agent.
No worries about scams.
https://fun88royal.com/fun888/
I came across this blog when I was searching about the steps to windows 11 free download 64 bit. This blog solved all my problems and also explained to me the importance of this new version of Windows. It is through this blog that I understood the new clearing inquiry feature that is provided by Windows 11. Undoubtedly, this blog has helped me get through the Windows 11 download process very easily.
ReplyDeletekayseriescortu.com - alacam.org - xescortun.com
ReplyDeleteDiscover the Best Online Casino Canada. We rank the most popular online casino.
ReplyDeleteThis site is a great stepping stone for any player that is just getting started with online gambling. 토토
ReplyDelete
ReplyDeleteDelta Airlines
deltaairlines
Delta Flights
Delta Tickets
Delta Airlines Tickets
Cheap Delta Flights
Book Delta Flights
Book Delta Airlines
Cheap Delta Airlines
Cheap Delta Tickets
Delta Plane Tickets
Delta.com
perde modelleri
ReplyDeleteMobil onay
MOBİL ÖDEME BOZDURMA
NFTNASİLALİNİR
ANKARA EVDEN EVE NAKLİYAT
trafik sigortası
dedektör
web sitesi kurma
aşk kitapları
beykoz beko klima servisi
ReplyDeletependik daikin klima servisi
tuzla toshiba klima servisi
tuzla beko klima servisi
çekmeköy lg klima servisi
ataşehir lg klima servisi
çekmeköy alarko carrier klima servisi
ataşehir alarko carrier klima servisi
kadıköy toshiba klima servisi
Das Casimba ist noch eine neue Online Spielebank, das auf dem deutschen Markt erst im Jahr 2017 seine Pforten geöffnet hatte. Auf den ersten Blick wirkt es unglaublich modern, was vor allem auf die reichhaltige Animation im Bereich der Startseite zurückzuführen ist.
ReplyDelete