Welcome to
part two of my 2022-2023 winter outlook. Part, one went into this seasons triple
dip La Nina, a few teleconnections, and the Hunga Tonga Volcanic eruption. Part
one, showed how both of those are arguing for a colder than average winter for
a large part of the Northeast. Part two will
go into the Pacific Decadal Oscillation, the Eastern Pacific Oscillation, the Quasi
Biennial Oscillation, and the Pacific North American Pattern, and how they
detract or enhance the atmospheric effect of the La Nina and Volcanic eruption.
Part two will go into possible storm tracks we should see this winter. As well
as some thoughts on the Polar Vortex. I will also go more into analogue winters
and make some adjustment from part one.
Teleconnections:
Pacific
Decadal Oscillation (PDO):
The PDO is a
change in the Sea Surface Temperatures pattern in the North Pacific Ocean above
20-degree north latitude. Like all teleconnections the PDO has a positive
(warm) phase and a negative (cool) phase. Generally during the positive phase,
warmer SST exist along the Northwest Coast and West Coast of Canada. During the
positive phase the wintertime temperatures tend to be warmer across the western
CONUS and cooler in the eastern CONUS, during the negative phase the opposite
is generally true. The Phases of the PDO can enhance or diminish the effects caused
by the ENSO. So, when we have a negative PDO during a La Nina, it can increase the
impacts on temperature and precipitation patterns typical of La Nina. The last
two winters involved negative PDO’s.
When we look
at the SST in the northern Pacific, we can see those warm SST off the West
Coast south of Alaska. It seems the PDO is starting to turn positive.

The La Nina,
PDO and the Hunga Tonga Hunga eruption will make this winter very distinctive:
As I said in
part one, this winter is going to feature a triple dip weak to moderate East
Based La Nina. The fact that we look to see a positive PDO during this coming
winter, is a big deal. Every other triple dip La Nina had a negative PDO. So,
therefor they enhanced the La Nina in those winters. So clearly as rare as
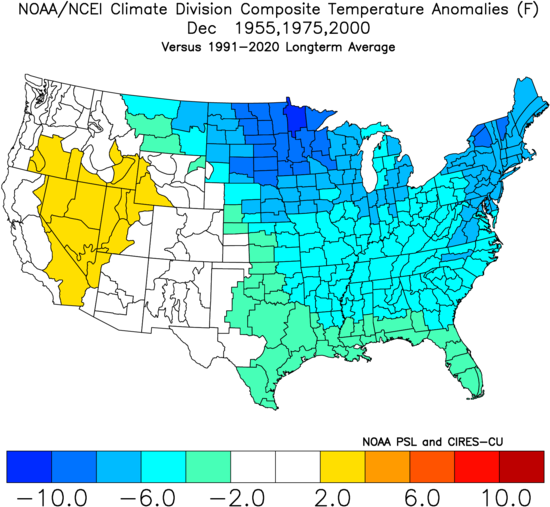
these triple dip La Nina’s are, this one is going to be one of kind. Looking
back at La Nina winters that had a positive PDO, we come up with 1908-1909,
1938-1939, 1984-1985, 1995-1996 and 2005-2006.
Only 95-96
featured a weak polar vortex and a strong very persistent negative phase of the
AO and NAO. That winter was an extremely snowy winter. Due to how the pattern for
the entire winter was perfect for winter storms. So that doesn’t mean this
winter would end up the same. But, each one of these winters featured average
to above average snowfall across our region.
Hunga
Tonga Hunga volcano:
In part one
I went into some detail on the Hunga Tonga Hunga eruption.
But that volcanic eruption is so unique, that it forces me to talk more about
it and the impacts it could bring for this winter.
Here are a couple of images that show the amount of Water Vapor from the eruption and its distribution across the globe. We can see that the amount of water vapor released is astonishing. We can also see that the vast majority of the stratospheric water vapor is confined to the Southern Hemisphere. The amount and distribution are going to have a big say in this winter’s temperature and precipitation pattern. In fact, the eruption aftereffects are the main reason this hurricane season has acted the way it has.


It all comes
down to balance, or in this case the lack of balance.
In part one I showed the stratospheric cooling at occurred in the Southern Hemisphere. When we go to see the stratospheric data from the CPC and look at the 30hPa layer of the Southern Stratosphere we can see that the current temperature (shown by the red line, is at a historically low level. It is well below the base line. The 50hPa layer shows the same kind of well below average cooling. All of this rapid cooling was a result of all that water vapor being sent into the Southern Hemisphere stratosphere causing the upper atmosphere to contract. As a result of the upper atmospheric cooling the troposphere ended up warming due to the expansion of the lower atmosphere


But when we
look at the stratospheric data for the Northern Hemisphere, we see the exact opposite,
those 30hPa and 50hPa layer temperatures are above average.


The Subtropical Jet has been very active this year; which is very atypical for a La Nina year. This is one of the main reasons this year’s hurricane season turned out the way it did. The Northern Hemisphere atmospheric profile was a blend of La Nina and El Nino; which led to all that extra windshear over the tropical Atlantic due to the active subtropical jet. So that well above average hurricane season forecast, never had a chance to get going. This was all a result of the global atmospheric circulation trying to find balance. This is already affecting the polar vortex over the Arctic. In these images we can see while the Polar Vortex over the Antarctic is very strong and well defined. The Polar Vortex over the Arctic is very weak and very elongated.
North


South


Source Earth
Null School
As this
pattern continues, the Subtropical jet is going to be much more active for the
2022-2023 winter than is typical of a La Nina winter. With the Polar Jet being active and also
having an active Subtropical Jet; there is going to be increased chances for
phasing involving the Northern and Southern Jets. How this phasing comes about
will be determined by these winters storm tracks.
Other important
Teleconnections:
The Quasi
Biennial Oscillation (QBO):
The QBO
deals with the variation in wind flow in the lower stratosphere at the 30hPA layer above the equator. The QBO can influence weather
patterns across the globe. This alternating belt of strong stratospheric wind completely
changes direction right around every 14 months. So, the full cycle is roughly
28 months. When the winds are westerly (WQBO) the QBO is in its positive phase.
So, when they blow in the easterly (EQBO) direction the QBO is in its negative
phase. The QBO has in influence on the strength
of the jet stream, polar vortex and the likelihood of high latitude blocking.

During the
positive phase winter temperatures across northern New York State into Northern
New England are more likely to be colder than average, with the Mid Atlantic
and New England likely to be drier than average. During the negative phase the
cold shifts south a bit; so Central and Southern New York State, Southern New
England, Pennsylvania, and the Middle Atlantic to be cooler than average.
During the negative phase the entire Northeast and Northern Middle Atlantic
tend to be drier than average.
Here is a
look at the QBO composites

Source…Philly
Weather Authority
Dec – Feb Temperature
and Precipitation anomaly probability maps.
Westerly QBO


Source World
Climate Service
Eastern QBO


Source World
Climate Service
Last winter
the QBO was negative; currently the QBO is in a positive phase. As of September,
the index was at +9.80.

This year
has seen the upper atmospheric winds fairly weak. Could this have something to
do with the volcanic eruption back in January? Maybe. With this, it should lend
some support for high latitude blocking and a decent chance for some
stratospheric warming here in the Northern Hemisphere.
The
Arctic Oscillation (AO) and the North Atlantic Oscillation (NAO):
The AO is a
northern hemisphere circulation pattern that influences the position of the
northern jet stream. It also has some influence on the strength of the polar
jet as well as the strength of the Polar Vortex.
During the
positive phase the Northeast and Northern Mid Atlantic Region generally see warmer
and more moderate winters. During a positive phase of the AO, the Polar Vortex
is generally strong.
During the negative phase the Northeast and Northern Mid-Atlantic Region generally see more in the way of cold and stormy winters. During a negative phase of the AO, the Polar Vortex is generally weaker.

The NAO deals with the air pressure pattern between Greenland and the Azores. During the positive phase, the CONUS generally sees a Zonal west-east flow, which typically keeps the cold air bottled up in Canada; this is generally because we see little high latitude blocking during the positive phase of the NAO.
During the negative phase, we generally see a lot of high latitude blocking over Greenland. The blocking forces the Jet stream to buckle, bringing cold air outbreaks into the Great Lakes and Northeast.

When we see an
east based La Nina, typically we see a predominate negative AO and NAO.
When the PNA
is positive generally in Western Canada and the Western CONUS. it is warmer
than average and the Eastern CONUS. is colder than average, there is also a
tendency for the eastern CONUS to see below average precipitation as well. When
it’s negative, we see the opposite occur more times than not. Currently the PNA
is in a positive phase.


Courtesy of
the NWS Climate Prediction Center
Given the
overall setup, I favor the idea of the PNA being primarily positive this
winter.
Eastern
Pacific Oscillation (EPO):
The EPO
deals with the atmospheric flow pattern across the Eastern Pacific including
Alaska. In other words, the EPO is about the placement of the trough around the
Aleutians into the Gulf of Alaska. During a positive EPO the trough is located
in the Central and Eastern Gulf of Alaska. As a result, we see strong Pacific
jet pushing in a mild north Pacific air flow pattern into the Western CONUS, as
this air flows over and down the Eastern slopes of the Rocky Mountains, it warms
up and dries out. This typically results in warmer than average temperatures
across the Central and Eastern CONUS. During a negative EPO the trough is
centered in the Aleutians into the Western Gulf of Alaska. This results in a ridge
over the Eastern Pacific off the West Coast. Because of the ridge, the western
flow of that mild Pacific air is diverted up toward Alaska. As Alaska warms, we see the cold Arctic air
displaced and forced to move down the western ridge into the Central CONUS. Because
of this the Plains and Great Lakes tend to be very cold, some of this cold
migrates East into the Northeast and Northern Middle Atlantic. So typically, our region tends to see colder
overall temperatures during a negative EPO.


This winter the EPO is going to be the composer, controlling how all these factors mesh. Because the EPO has a major influence on storm tracks across North America.
Storm
Tracks:
This winter’s
storm tracks will be based on the idea of moderate East Based La Nina that will
weaken as we get into Midwinter, this along with the pattern setup caused by a
positive PDO that interacts with a primarily negative AO and negative NAO and
the phase orientation of the EPO during the winter of 2022-2023. This will be
enhanced by the results of the Hunga Tonga Volcanic eruption making for a very
active subtropical jet, and the increased chances for higher latitude blocking
over Greenland due to the QBO. The type of storm and precipitation type will be
mainly determined by the phase of the EPO and NAO; these are variable and so we
will see a range in outcomes.
When the EPO
is positive, the pattern would favor a general storm track into the Great Lakes. A positive NAO would mean a lot of snow into
the Western Great Lakes. We would expect mixing over the interior parts of the
Northeast into the Eastern Great Lakes, with a quick change over to rain along
the coast. If the NAO is negative, The Northeast would expect to see a
substantial mixed precipitation type storm.
When the EPO
is negative, the pattern would favor a general snowstorm in the Northeast and
Middle Atlantic. A positive NAO would mean
a less chance for phasing between the northern and southern jets, with a general
track farther from the coast, this would favor snow for interior New York State
and Pennsylvania, leaving the Middle Atlantic and New England more likely a
missing out on heavy snow. If the NAO is negative, The Northeast and Middle
Atlantic would expect to see a substantial winter storm, due to the high likelihood
of both jet streams phasing, with even the potential for a triple phase event.
A triple phase storm is when we see the subtropical Jet, the Pacific Jet and
the Polar Jet all phase. A true triple phase snowstorm is rare but when they occur,
they end up as monster snowstorms. The
pattern this year is going to favor the chance for Miller A and Miller B nor’easters.

Polar
Vortex:
As I showed
earlier the Polar Vortex has been very disrupted and fairly weak. Now while the
Polar Vortex is strengthening as it should be at this time of year. But given
the factors I went over; I don’t see the Polar Vortex becoming strong this
winter. So it will be easier for the vortex to elongate and split.
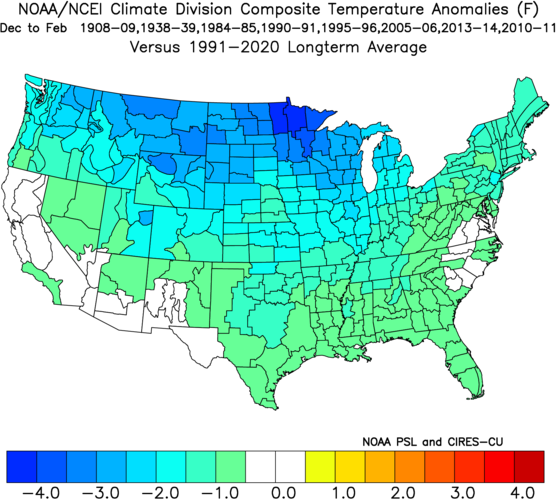
Analogues:
1908-1909,
1938-1939, 1984-1985, 1990-1991, 1995-1996, 2005-2006, 2010-2011, 2013-2014.
These
analogues are based on winters that had a positive PDO with an East based La Nina,
had similar SST pattern, and a cool southern hemisphere.
Conclusion:
In part one
I discussed how December and January look to be active and wintery. I still believe
this to be the case. It is unclear how the end of February into March will act
due to the weakening La Nina.
I believe the
polar vortex will be weak and will have the potential to be disrupted several
times.
The
subtropical jet is going to stay active right through the winter, which is something
we don’t typically see during a La Nina winter.
Based on the
analysis so far, I think this winter will end up colder overall than I
indicated it would be in part one. The pattern is looking to be very active
with the chance for several cold outbreaks. The pattern should produce several opportunities
storm tracks near and offshore, with the idea of prevalent blocking over Greenland
due to a general negative NAO, the chance for these storms phasing will be
rather high. As for the Lower Great Lakes, this looks to be an active lake
effect snow winter.
Eastern Long
Island along the Connecticut Coast into Rhode Island, look to see near average
temperatures, and average snowfall.
For Maryland,
the major Cities along the I-95 Corridor, Eastern Long Island, Southeastern
Massachusetts including Boston will see average to slightly above average
snowfall with overall temperatures ending up around average.
For much of
the rest of the interior Pennsylvania, New York State and New England,
generally below average overall temperatures with snowfall ending up above
average. This is looking to be a good Lake effect snow winter.
Well, that’s
it. I will be releasing part three end of November into the first week of December.
Part three will cover the overall trend that has been occurring since part two
was released, and will attempt to narrow things down a bit more.