Saturday, October 20, 2018

My official 2018 2019 winter outlook.


I started talking about this coming winter even before the summer.  I've directly and indirectly said I believe this winter will be quite cold and chilly. I said months ago that this winter most likely would be coming early and staying late. The success I had forecasting during this year's Atlantic hurricane season is the same pattern going forward. The Pacific and Atlantic tropical seasons will have an impact on winter 2018-2019. I've been trying to keep all y'all informed; I started posting my preliminary  thoughts on this winter back on August 7th. But even way before that I've posted about the evolving pattern and how that pattern related to this upcoming winter.   If you haven't read my preliminary winter thoughts, I encourage you to do so. Here are the links.


Those three part installments laid the ground work for this post.  We are now in the last part of October. So far everything I've been talking about  on my weather pages and in several blog post has come to past.  we are now quickly changing over the winter pattern; the cold has indeed arrived early.  Before I get started, first of all let me say for the umpteenth time , I think it will be a cold and snowy winter for much of the eastern half of the U.S.

But remember  I'm talking overall colder than average temperatures and above average snowfall for most of the Northeast and the Mid Atlantic. It won't be subzero all the time; as we see every winter there will be warm ups from time to time. Also remember wintertime precipitation is  sleet, freezing rain, snow, and sometimes even rain.  The pattern going forward will support all of these at some points over winter 2018-2019.

Last winter we saw a lot of variable conditions.  It started out cold, then got very cold from around Christmas into the first week of January.  Mid January into much of February we warmed to well above average. Then cooled back off for March into Much of April.  We also had five major nor'easters. One In January and four back to back in March. 

OK what about this winter:

The Northeast and Middle-Atlantic have turned very cold  by October standards.  As we get  into November the trough will adjust west and sit over the Plains.  Then it should adjust back east as we get into winter.

The models are moving toward the thoughts I've been laying out.  Even the CFSv2  (which normally has a hard time finding cold in any pattern) is coming around to the idea that the Northeast and Mid-Atlantic will be quite cold this winter.  The JMA and Euro are also adjusting to a very cold look for December through February.  The Euro weekly is showing a lot of cold for 2/3 of the CONUS over the next 46 days, the core of the cold looks to be over the Great Lakes, Midwest, and the Northeast.  This would absolutely play into the pattern I've been talking about for months.

Here is how the CFSv2 has been progressing.


The Euro 46 day overall temperature anomaly.


 Analog Years:

1958-1959 1968-1969, 1972-1973 1976-1977,1977-1978, 1986-1987, 1994-1995, 2002-2003, 2006-2007, 2009-2010, 2014-2015. 2002-03 is leading the pack at least for now.  If you remember back to 2002-03 that October acted very much like this one. Other years that are in the running are 1968-69, 1986-87, 1994-95, and 2009-10, 2014-2015.  When doing analogs we blend the years that had similar patterns; this is what the temperature outlook maps are based on. The maps show an overall blend of those analog years.  So during the winter, different aspects of those analog years will manifest themselves.   

Looking at the Sea Surface Temperature (SST) anomalies:

The Pacific:

     The El Nino Southern Oscillation (ENSO):

Winters  tend to be colder than average in the Central and Eastern US during El Nino Modoki, as opposed to an Eastern based normal El NIno which tends to be warmer in the Central and Eastern U.S.

The ENSO  region in the Pacific is heading toward a  weak to moderate  Modoki  (centrally based) El Nino in the tropical Pacific. The El Nino conditions are becoming more and more apparent.   Looking at the global SST pattern, the tropical Pacific has a very distinct El Nino look.  We can also see the colder SST near South America. Over the next several weeks we will see the ENSO evolve toward a Modoki even more.  The subsurface water temperatures  already show the El Nino Modoki footprint. The reason a Modoki leads to East Coast troughing has to do with how energy release forces a trough north of the center of the warm SST. If the heat is in the central Pacific then there will be a trough in the north central Pacific south of the Aleutians. This would cause a ridge east of the trough. This ridge would be over the West Coast. This in turn means a overall trough would be over the East Coast.  If the warm SST were in the eastern Pacific, the process would cause a trough over the West Coast and a Ridge over the East Coast. We saw this occur back in 2015.  


     The Eastern Pacific Oscillation:

When we have a Modoki El Nino, it improves the odds for a negative EPO. A negative EPO would allow the eastern Pacific to warm up, bringing some of this warmth to the west coast of North America.

     The Blob:

Warmer than normal water in the northern Pacific. The blob is looking quite extraordinary. The last time it looked similar to this was the winter of 2014-2015. A strong blob Is a good indication of West Coast Ridging setting up during winter 2018-2019.

      The Quasi-Biennial Oscillation (QBO):

The QBO has a direct correlation to winter weather patterns.

The QBO is east based but is trending west. But I think we will see the east based QBO hang around into February. This is important, when the QBO is in the eastern phase we tend to see more stratospheric warming events, especially when combined with low solar activity.   


      PDO:

The Pacific Decadal Oscillation (PDO), like all teleconnections it has a warm and cool phase. The PDO has a big impact on the strength of the ENSO. The PDO can intensify or diminish the impacts of the ENSO. A warm phase PDO will work hand in hand with an El Nino. A cold phase in the PDO will amplify the effects of La Nina. Conversely, if the PDO and ENSO are in opposite phases they act as a counter balance to each other.  Last fall we had a positive PDO that was trending negative.  Winter 2017-2018 featured a neutral trending  to a negative PDO.  The result was we had  a trough in the west and a stronger than average southeast ridge what causes all kinds of havoc with our winter temperatures.   

 The PDO is positive (This is the so called "warm blob" That sits just south of Alaska)  and that looks to continue into at least Spring of 2019. This would help promote the western ridge and an east trough. This would help ensure  below average temperatures in the Southeast, Mid Atlantic into the Northeast. This would also favor above average winter precipitation too.    

The Atlantic:

We have above average SST along the East Coast and Gulf of Mexico.  Those warm SST will help to lend support to any coastal storms that do develop.  With general  eastern troughing expected,  we should see chances for digging troughs to amplify and phase with the cold arctic air.  So there will be a chance for at least a few bigger Nor'easters.

Colder than average temperatures near Greenland.  The winter of 2014-2015 saw this area of the North Atlantic even colder than it is now.  Those on the global warming side of the isle say this cold blob is because the current and circulation patterns in the Atlantic are slowing.  But I think it is just because of climate variability.   

The Atlantic Oscillation (AO) and North Atlantic Oscillation (NAO) have been strongly positive for a long time.  But Hurricane Michael has forced a pattern change. Part of the change was warming in the stratosphere. As a result of that the AO and NAO have both tanked.  With the negative AO and NAO we now have blocking setting up. The blocking is leading to all that cold Canadian air to pour south into the U.S.  This kind of blocking pattern is exactly what one would expect from a east based QBO.  Those cold SST around Greenland is a good signal for a colder Northeast.

The  Indian Ocean:

The east  Indian Ocean is cooler than the west Indian Ocean and northeast of Australia.  This is important,  when we have that setup in the Indian Ocean and a El Nino we tend to see the MJO try to stay neutral or stay in the colder phases for the East Coast.  Phases 8,1, and 2.

The Madden-Julian Oscillation (MJO):

The factors above have an influence on the MJO.  The MJO will be what decides where the strongest convection will set up.  This in turn will affect how the Pacific jet behaves.  Last winter the MJO moved into warm phases 4,5, and 6. This caused the warmth we experienced for the end of January and February.  When we have a Modoki El Nino the MJO is typically able to push farther eastward do to the effect on air motion in the Central Pacific.  This leads to plenty of moisture for MJO caused convection.   A Modoki El Nino sees warm SST in the central Pacific with cooler SST east and west of there. Typically when we see colder SST in Indonesia we tend to see the MJO stay mostly or completely in the colder phases 8,1, and 2. This is another key showing we should have a colder winter.

Solar Cycle:

Low solar activity is a sign for cooler as opposed to warmer winter temperatures.  There is a weak correlation between solar activity and temperature.  The reason for this is most likely because when the Sun is quiet we have last solar radiation impacting the atmosphere. It has been noticed that when we have less solar radiation impacting the Earth, we have increased ozone levels in the Stratosphere. A warmer Stratosphere over the Arctic means the polar vortex is weaker, which makes it easier for pieces of the cold arctic air can break off and migrate south into the CONUS. It was Drew Shindell who first noticed the connection between ozone level and temperature. 

This season we have a very quiet Sun. So this supports my thoughts on a colder than average winter here in the Northeast.  

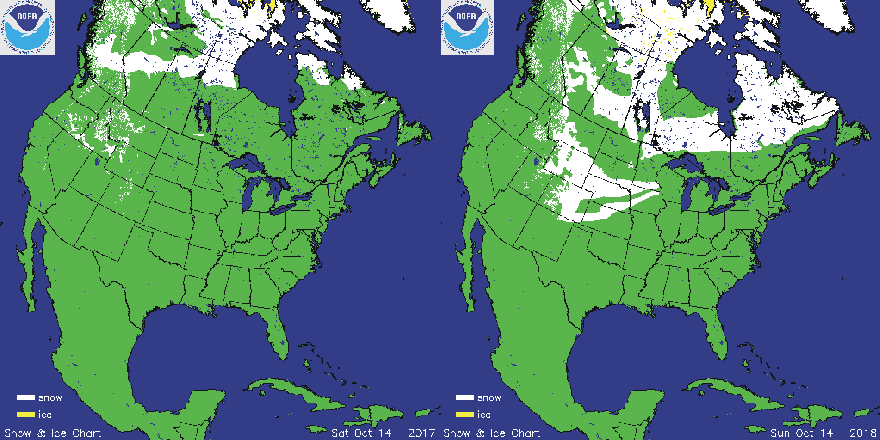
Snowpack and High Latitude Blocking:

Northern Hemisphere snowpack is valuable tool in trying to figure out if we will see high latitude blocking during the upcoming winter. This can help us gauge if the winter will be more inclined for cold shots.   Siberian snow cover is behind from where it was last year at this time. could this throw a monkey wrench into my outlook...maybe.  But on the other hand,  the area where the snow is located is more important than the extent of coverage.  When looking at Eurasia we're concerned if there is snow below 60 N;  There has been  expanding  snow in that part of Siberia.  So based on Eurasia snow cover, there is weak signal for high latitude blocking.   The Canadian and Greenland Snowpack are well above average for this time of year.  There has also been snow in the Rockies, this is ahead of last year.  Snowpack is a very important factor; the more snow the more modification the air masses will experience over the winter  as they drop south.


There is a correlation between years that have low solar activity and blocking near Greenland.  All of this is a good indicator that we should see above average chances for blocking this winter.

There is a correlation between tropical activity and East Coast winter temperatures.  Strong October Gulf Hurricanes tend to precede cold East Coast winters.  Another interesting tidbit, is years that saw a Pacific tropical cyclone impact the desert Southwest also lead to cold East Coast winters.  This year we saw two do this.

The bottom line:

Summer into Fall 2018 has been acting very El Nino Modoki like.

Temperature:

I have strong confidence that I'm right on the developing pattern.  All of the factors I went over work to influence the Idea of an East Coast Trough, with the higher probability for Greenland Blocking, I think this will be a fairly cold winter. Here is a look at both my thoughts on winter temperatures across the CONUS and for the Northeast and Middle-Atlantic.

We have to expect the trough over the east right now, will relax and pull west for part of  December, maybe even into the start of January. But any warmth for December/January shouldn't be a blowtorch. The warming could last two to four weeks. During this time, we would see more in the way of  temperatures  slightly above average to above average. November will still most likely end up being overall below average. The cold that is available could overwhelm the pattern, making for some periods of near record to record breaking cold.  December most likely will be warm. But the seasonal temperatures should come back around Christmas.  The first week or two of January could be warmer than average. Then the bottom could fall out, with things becoming very cold. The analog years I've latched onto would support that Idea. But I think ,  the rest of January, February , and into March look pretty overall cold based on the analogs and the pattern that has been with us all year.  The Models are trending colder, this is a good sign that I'm on the right track for this upcoming December through February timeframe.  


Winter Precipitation:

Winters that feature an El Nino Modoki tend to see more of an active southern jet stream.  An active southern branch increases the likelihood of East Coast winter storms. ... more snow storms....more snow.  This is why I have the Middle-Atlantic into the Southeast with well above average snowfall for this winter.  There is also the risk for a few ice storms this winter. The Ice storm risk will be greatest in the Southeast; but, I can't rule out the possibility of an ice storm in the Northeast.  I'm thinking this winter will see slightly below average to average lake effect snow in the snow belts . But lake snow is volatile so trying to forecast the entire Lake Effect season is almost impossible.  But based on the analogs, I think my Lake effect idea has merit.   


If something happens that changes my mind on some of this; I will post an update on the temperature and precipitation pattern for this winter around mid November.

Images courtesy of WeatherBell Analytics, Tropical Tidbits, National Oceanic and Atmospheric Administration, National Solar Observatory.


Sunday, October 14, 2018

Michael ... what caused him to behave the way he did?


This post deals with Hurricane Michael that made landfall on the Florida Panhandle Oct 10,2018. Prior to landfall Michael exploded in intensity. This caught many by surprise.  Many residents that stayed to ride out Michael most likely would have evacuated had they known how strong Michael would be at landfall. I will explain the processes that forced Michael to take the track he did...and try to offer some thoughts on why I think he intensified the way he did.  Due to its nature, the subject matter will be a little bit technical, but I will try to put it in a way that the general layperson can understand.    

In regards to Michael:

A few days ago I posted on my Facebook page, how my team and I handled Michael.

"I think the team and I did a good job with Michael.  He did get slightly stronger than I thought he would. But days ahead of landfall I said a Category 3/4 was going to strike the Florida Panhandle. He came in as a borderline Category 4/5.  As they did with Andrew, they very well could declare Michael was a Category 5 hurricane.   

  When Michael started forming, I thought he would make a land fall close to the Louisiana and Mississippi border. I soon corrected this and shifted my landfall idea farther east.   Tuesday I indicated landfall would be Wednesday  late morning into early afternoon, between Destin and Panama City, but he could go as far east as Mexico Beach.

It can be very difficult to accurately stay ahead of a storm like Michael.....but like we did with Florence, we did alright with Michael".

Most of today's meteorologist and meteorological students rely too much on computer model simulations. Don't get me wrong, I use models all the time too. But not to tell me what is going to happen.  Instead I use them to verify stuff I already know. I never rely on the models to do my homework for me, I do my own math, physics, and all the rest. There is a ton of mathematics involved in meteorology; the inability to do the math is the chief reason students quit school or look for another career path.      When doing weather forecasting of any type you have to get the overall picture of the pattern in your head.   You look at the data presented and dissect the atmosphere from the surface to 200 mb layer by layer.  Then you plug that into your brain to compare to what you already know about the existing pattern and how it evolved to get to this point. Then you compare the pattern you see developing and compare that to pass years.  Once you have all that in your head, you're ready to make some educated guesses and come up with a forecast.  

Anyway Back To Michael:

Michael made landfall Wednesday the 10th of October, 2018 around 1:35 p.m. as a top end Category 4 hurricane with max sustained winds of 155 mph, and a central pressure of 919 mb. This makes him the strongest hurricane to strike the Florida Panhandle over the last 150 years of records for that region.  This makes Michael an extremely rare event; But it was far from being unprecedented. There have been hurricanes in the past that behaved and  followed a track similar to Michael's.       

I'm seeing the inevitable and expected Hurricane Michael was caused by Climate Change and or Global Warming.  This stuff is popping up everywhere. A lot of emphasis is being placed on those very warm Sea Surface Temperatures (SST). But warm SST was only one part in a complex setup.    I will state for the record,  Hurricane Michael, wasn't caused by climate change.  The reasons for Michael were strictly environmental and climatology. 

The conditions in the Northeast Gulf Of Mexico (GOM) were textbook for rapid intensification.  We had very warm sea surface temperatures, lots of tropical moisture,  a very favorable upper air pattern caused by the MJO, and the time of year. As well as the northern ridge and approaching trough of cold air played a big role as well.  I will touch on why that cold air might have been very important to the rapid intensification Michael experienced.  Rapid intensification is when a hurricane increases it's sustained wind speed by at least 35 mph in a 24 hour period. 
  

Eye-Wall Replacement Cycles (ERC):

Michael went through three eye wall replacement cycles before landfall.   When Florence had her ERC's she increased the size of her wind field.  Michael went the opposite direction, following his ERC's he decided to deepen instead.

SST and moisture:

 
The Gulf Of Mexico was extremely warm in September; those waters were slowly cooling as we got into October, but they were still more than warm enough for a storm like Michael to form.  The water in parts of the northeast GOM were just over 3.5 degrees Fahrenheit above average.  Those waters weren't just warm on the surface. Subsurface water temperatures were well above average down to 300 /400 feet. That is a lot of heat potential for a hurricane to feed off of. There was also a lot of atmospheric moisture for Michael to tap into. Michael's large area of circulation was also able to pull in moist air from the Pacific. Midlevel relative humidity was 70% to near 80%   But because of his interaction with nearby land areas there was some dry air he had to deal with. 

Wind Shear:

At first the wind shear kept Michael's eye wall from completely inclosing his center.  On October 4th Michael wasn't even an Invest yet. Wind shear was very high at 20 to 40 knots.  This wind shear was blowing a lot of Michael's heavy thunderstorm activity to the east.  As the subtropical jet pulled north during the week wind shear lessened.  Wind shear was moderate at 20 knots on the 7th of October; Michael also had to deal with a Gyre over Central America.  A  Central America Gyre (CAG) is a large closed area of surface low pressure.  These Gyre's occur during the rainy season normally from May to November. SAG are typically fueled by phase 8 and 1 of the MJO.   When we have a tropical cyclone develop it is typically found on the GYRE's eastern side.  Tropical Storm Nicole formed south of Cuba in 2010 because of this process. Last October we saw Nate form from a CAG.  On early morning  October 9 moderate wind shear of 15-20 mph was still present. The eye was elliptical. But by mid morning the eye was much more circular. Temperatures in the eye were quickly rising at this time  and the eye wall was  beginning to close off.  The eye wasn't completely closed off by late afternoon.     Upper level dry air had been interfering with Michaels core development.  But as the eye wall closed off this dry air would be kept at bay.  The eye wall closed off during the evening of October 9th. This was caused by the upper level low to Michael's north weakening and pulling out of the way.   The upper air system pulling away also dissipated most of the wind shear clearing the way for Michael.  


Upper Air Features:

The MJO was the major key to how Michael behaved. I've been explaining how the MJO influences raising and sinking air as it moves through its eight phases.  The MJO. It is why we saw Rosa and Sergio in the eastern Pacific. MJO is also the reason we just had Florence and now Michael.  MJO phases 1 and 2  . The MJO went into Phase 2, this is a sign  that air would be rising in the western Caribbean and eastern Gulf.

A few hours before landfall, Michael was effected by a low level jet streak. This allowed him to finally develop excellent top level outflow. This allowed him to become completely vertically stacked.  Vertically stacked means the surface low and the upper level low are sitting on top of each other (not tilted with height).  Once a storm is vertically stacked it is like a chimney allowing a hurricane to exhaust  it's outflow quickly and efficiently  allowing the storm to  build vertically. The higher the cloud tops the colder and stronger they are.  Once this happened, Michaels eye wall  fully closed off insulating Michael's core from that layer of dry air.  

Time Of Year:

October is the time of year all eyes start to watch the southern and western Caribbean. In October climatology favors a northern turn for storms in the Caribbean where they track into the GOM. This is because that late in the year the northern hemisphere is switching from a summer pattern to a winter pattern.  Because of this we see strong cold fronts drop south out of the Plains.  This is why it is very difficult to have a land falling tropical system  in Texas during October. 

Here is a chart that shows where we expect to see hurricanes form in October.
 
Michael formed exactly where we would expect him to develop.  The SST were very warm for October. Michael was the perfect opportunist and took advantage of this fact and explosively developed.   Once Michael got into the Gulf he went from a category 1 to a top end category 4 hurricane in 24 hours. That is extremely rapid intensification. But again it isn't unprecedented. The 1935 labor day hurricane that struck the Florida Keys, went from a category 2 to a category 5 very quickly as well.   

 The high heat content. Time of year, and the overall pattern created the perfect environment for Michael.  An environment that allowed Michael to deepen in spite of moderate wind shear.  I will explain some ideas on why this most likely occurred.

Some thoughts on why Michael laughed at the shear: 

There is no doubt that the speed of Michaels intensification took many meteorologist and therefore the general public by surprise.  On its face value it was weird.  But we have to look deeper into the setup and pattern to discover why he strengthened in the face of moderate wind shear.  

Part of the reason Michael endured was the size of his eye wall and overall size. This helped protect his core to some degree.  But the real reasons are much more subtle.  To see how he reached major hurricane status without an intact eye wall, we have to look at the currents in the GOM and the 200 hpa wind speed and vector direction.
 

       1) the Gulf Loop Current And Loop Current Eddies:

When looking at a hurricane projected track, we look at the overall general SST's ahead of the storm.  The models factor in these general overall temperatures.  As I've already said, the subsurface temperatures were very warm deep down.  Wind and ocean currents and eddies are the major ways that heat can get to the surface.  Following Michael's passage, winds upwelled subsurface water, temperatures in Michaels' wake are cooler now than they were.   SST's are never uniform across any body of water.  There are areas were the water is much warmer or cooler than the overall average of the water.  The reason for this has to do with currents and eddies.

The GOM loop current , is a flow of warm water  from the Caribbean going into the GOM.  The current moves between the Yucatan and Cuba. From here it moves into the GOM and then loops back around and moves through the Florida Straits on its way to the Atlantic Ocean and the Gulf Stream. The extent of the loop varies; sometime it just makes it to the GOM before turning toward the Straits, other times it can extend almost all the way to Louisiana before looping back south and through the Straits.
 

We saw the effect of the loop current when Hurricane Katrina passed over the current in 2005 she quickly jumped to category 5. But once she moved away from the current she weakened back to a category 3 hurricane.   In 2008 we saw hurricane Ike move over a the loop current and a loop current eddy and rapidly intensify.  Gilbert in 1988 and Charley in 2004, another 2005 storm Rita also underwent rapid intensification passing over the loop current.  Michael formed in the same area that Hurricane Camille formed in 1969. The loop current is something that needs more research and study. But it makes late season tropical cyclones unpredictable in the Gulf.

The loop current is one of the major reasons Michael Intensified. The models didn't accurately account for temperature variance caused by the loop current. The temperature difference between the surface of the ocean and the upper atmosphere is one of the major reasons a storm intensifies.   But it doesn't explain how he shrugged off the wind shear the way he did.  For that we have to leave the surface of the GOM and look at the upper atmosphere jet stream. 


       2)  the200 hpa wind speed and vector direction:


When we look at the upper air pattern we can see the approaching trough over Texas.  This trough was responsible for the wind shear ahead of Michael.  Ahead of the trough we have very warm and moist air. But the trough is bringing much cooler air.   The jet that is running between the two air masses will respond to the temperature difference.  This setup enhanced the jet overhead. All of this changed the direction and strength of the shear ahead of Michael.  It is also enhancing upward motion ahead of Michael.   As Michael headed  into the ridge the atmospheric setup quickly becomes very favorable for rapid development.  The environment around Michael allowed him to develop his own anticyclone overhead....allowing him to take control of his environment all around him. That trickle of cold air could have helped Michael intensify as well.


The setup was different, but many of these same factors was the reason Sandy behaved and strengthened the way she did.  Storms that undergo rapid intensification are more dangerous than other storms , be it a hurricane or a nor'easter.  When Michael exploded in intensity it was during the overnight and there was no way to warn anyone about it.

In closing:

As have monster hurricanes in the past, Michael showed why you can't use a hurricanes current wind speed for deciding if you should evacuate. The same thing happened with Sandy, Florence, Andrew and many other past storms.

This covers the main reasons Hurricane Michael acted the way he did.  Intense hurricanes right on the coast are always worrisome. Days before landfall I warned about the dangers Michael posed, and that Michael would still be intensifying right up to landfall.   Michael took advantage of perfect conditions and a complacent public.  Michael showed why hurricane models are nowhere near sophisticated enough to make a complete forecast.  We have to look at the overall pattern; but we also have to look at the sub-pattern around the storm and how that sub-pattern could impact development down the road.

That about covers what I wanted to say..........I hope you found this educational and enjoyable to read. As always I will try to answer questions.
Images are from Tropical Tidbits, Weatherbell, and NOAA. 


Wednesday, October 3, 2018

Is it time to say goodbye to the Saffir Simpson Wind Scale?


Among Meteorologist, the limitations of the Saffir Simpson Wind Scale is well known; but that doesn't really apply to the general public. The talk about the need to upgrade or just do away with the Saffir Simpson Wind Scale has been around for quite some time. But here we are in 2018 still talking about it.

What is the Saffir Simpson Wind Scale:

The Saffir Simpson Wind Scale was devised by civil-engineer Herbert Saffir and meteorologist Bob Simpson in 1971.  The Scale has always been about assigning a category from 1-5 based on maximum sustained wind speed.  The measurement is a one minute average at 10 meters above the surface.  The scale also associated a minimum central pressure and most likely storm surge values.  The surface pressure was included to help assign a category to the hurricane. Because at the time it was very difficult to accurately measure surface winds from the recommence aircraft.  But to help measure those surface winds, dropsondes were developed in the 1990's. A dropsonide is a device dropped from the reconnaissance aircraft to measure storm conditions within a tropical cyclone. As it collects the data it transmits it back to the aircraft.  Then in 2005 the improved stepped frequency microwave radiometer (SFMR) was deployed.  The SFMR  Is a small sensor under a hurricane hunter aircrafts wind. that measures surface wind speed, that uses 6 microwave frequencies to accurately measure hurricane force winds. Because storm surge for a peculiar Category is sometimes higher or lower than the scale would call for.  Because of this the National Hurricane Center now only uses the wind scale without including surge height.       


A recent history lesson:

I started looking at a particular  tropical wave over Africa on Aug 26, 2018. Even then I could see the potential. On the 28th, the National Hurricane Center (NHC) started to officially track the wave; at that time they gave it a 20% chance for development over the next 5 days. The NHC dropped the chances to 0% the next day.  On the 30th, the wave that would become Major Hurricane Florence move off of Africa and into the Atlantic Basin. On Sept 1st the tropical wave, was officially given the name Tropical Storm Florence. On the 4th of September she became a Category 1 hurricane. The next day she became a Category 4 storm. But by the next day she was downgraded to a tropical storm. On September 9th she once again became a hurricane. The next day she was once again a Category 4 with max sustained winds of 140 mph.  Over the next nearly 4 days she remained a Major Hurricane ; as she dramatically slowed down. Then Florence rapidly weakened but continued to increase her wind field..  She made landfall near Wrightsville Beach, North Carolina as a Category 1 hurricane. Her main impact as she moved inland aside from a 10 to 12 foot storm surge, was days of heavy rain that caused catastrophic flooding. Some locations received 4 feet of rain. 

Here are some Maps that show Florence's track and some of the dates and times that I refer to above.


 Meteorology and Florence:

Most weather outlets called Florence unpredictable, Odd, and weird. Many thought she took a bizarre track. While it is true, by September 4th she was in a location where tropical cyclones typically recurve north and out to sea.  Florence made history on the  7th of September. On that date, no tropical cyclone in recorded history had  passed within 100 miles of that location and still make an US Landfall. She was also the farthest north Atlantic Basin Category 4 hurricane  in recorded history.  She played lots of tricks. But I wouldn't call her unpredictable.  Over a week out I forecasted Florence would most likely make a landfall between Wilmington and the Outer banks (Cape Lookout). The setup in the Atlantic was perfect for a storm like Florence to take the path she did. Hurricane models couldn't see it. But a person doing her homework and looking at the overall setup could see it. This is why models are only one of the tools available to a meteorologist. Meteorology is a complicated science far too complex for our current weather models to handle. Maybe in 20 to 30 years the models might be very accurate. But not today. The only thing that can unwrap the complexity is the human mind.  Meteorologist all have different interpretations, understanding, and methods. This is why forecast can be quite different from each other. Sometimes these different approaches can cause confusion.

There has to be a better way:      

The fact that she fooled many people (including the National Hurricane Center) and her rapid weakening two days before landfall, along with her slow forward speed. Caused a lot of confusion and most likely contributed to the loss of life that occurred.  This is where the SSWS comes into play.

The private weather forecasting outlets like Weatherbell Analytics  have come up and use different impact scales.  I've talked and wrote on my belief that we need to change the way we convey the dangers of severe weather to the general public. Both the Storm Prediction Center (SPC) and the National Hurricane Center (NHC) need to update how they go about things.  The good news is the SPC has been moving in the right direction in this regard.  However, the NHC has been much slower to make needed changes. The NHC needs to upgrade not only the Saffir Simpson Wind Scale but also their "Cone Of Uncertainly"  I've never been a fan of tracking just the center of the storm. It needs to be upgraded to show the breadth of the dangerous tropical weather. The public has a very poor understanding of severe weather. When it comes to the NHC cone they figure the most danger must be in that center that is being tracked. But this kind of thinking is very precarious and can lead to deadly outcomes. Wind and water are a very deadly combination. The roots of the public misconceptions lie at the heart of the Saffir Simpson Wind Scale.

The public misconception involving hurricane categories:

Hurricanes like Florence and Sandy lead to dangerous assumptions from the public.   The news media is fixated on the category number. Part of this goes back to my post on weather hype. But when the public learns that a hurricanes max sustained winds are diminishing the danger they are in also goes down. When Florence rapidly loss intensity going from a major hurricane to a category 1; many people stopped paying attention and decided to not evacuate. The Same thing happen with hurricane Sandy when she came ashore in 2012. Prior to Sandy's landfall the NHC issued hurricane warnings; But two days before landfall she was downgraded to a post tropical storm. The reason the NHC did this had to do with procedural reasons and nothing to do with impact. When Sandy made landfall near Brigantine, New Jersey she came in with the force of a major hurricane. I call her a major not because of her wind category but because of her central pressure, size, and impact. The storm surge that came in with Sandy was catastrophic for the New Jersey and New York State coastlines.  In Sandy's wake, 72 people died in the Mid-Atlantic and Northeast. Would people have evacuated Breezy Point, the hardest hit area during Sandy, if the emphasis was less on names and categories and more on impact? The stories people had who rode it out say yes they would have.

Florence weakened before landfall, why?:

  Why did Florence weaken approaching the North Carolina Coast?  One reason was that she continued to grow in diameter. As she went through eye wall replacement cycles, instead of dropping her central pressure, she instead became a larger storm.   The 2nd reason is the bigger the hurricane the faster it will weaken approaching the coast. Small hurricanes like Andrew like to strengthen approaching the Coast. But large storms like Florence or giant storms like Sandy normally won't.  The reason for this is the bigger the storm the more effect the land has on the hurricanes inflow, cutting off  part of the moist warm air that is feeding the storm; also the land interaction causes a distortion in the pressure pattern in and around the hurricane.  When the focus is on a number the main dangers from a land falling hurricane are glossed over or just forgotten.  Believe it or not, wind speed is not the main reason people die in hurricanes. Most  of those who die in land falling hurricanes drowned.

But Florence was trending South?:

As the NHC Cone Of Uncertainly shifted south, people north of the center of circulation thought they were safe. But nothing could have been farther from the truth. The area to the right of the storms direction of movement is called the right front quadrant. The right front quadrant of a tropical cyclone is the most dangerous area of the storm. This area due to the direction of the winds has the most destructive  winds and the highest storm surge. It is also the area most likely to see tornadoes; due to the fact that surface winds are stronger in this sector; this caused a change in  the wind speed and direction of winds with altitude. This is called wind shear. The more veering wind shear you have the greater the likelihood for tornadoes.        

Why the Saffir Simpson Wind Scale needs to change or be replaced:

The problem with the modern Saffir Simpson Wind Scale is the fact it doesn't account for size, central pressure, rainfall potential, storm surge, and tornadoes. Other important factors not considered are , forward speed, angle of approach, and the shape of the coastline.  

The overall size of a hurricane is a huge deal. The larger the wind field the greater the area impacted.  The larger the hurricane the more people effected and longer they will be impacted by hurricane force winds. The cumulative effect from a long duration hurricane's wind field is staggering. Florence was the perfect example of this.

Storm surge is the component that has the greatest potential to kill people and cause destruction. Storm surge is a wall of sea water approaching and moving ashore. Surge is very much like a tsunami. Wind driven waves sit on top of the surge.  Storm surge is a factor of the  size of the hurricane, forward speed, shape and characteristics of the coast line, central pressure of the hurricane, and the angle of impact. All of this has to be considered when dealing with storm surge. If a hurricane's right side is approaching a part of the coast that has a concave shape. The height of the surge will be higher, because the coast shape is cupping the flow of the water.  The slope of the continental shelf the surge is moving over is also important. A shallow slope will mean higher heights of sea water coming ashore.

 Rainfall from a slow moving storm like Florence will cause massive inland flooding. When a tropical cyclone makes landfall people drown in both salt and fresh water.  Bill, Irene, Lee, Harvey, and Florence brought catastrophic flooding rains to regions far removed from the point of landfall.  Tropical cyclones often have a one two punch aspect.  Wind and surge impact the coastal region, then a larger area deals with the rainfall.  If you drop 20, 30 or over 40 inches of rain on flat ground you will get fresh water flash flooding and urban flooding.  If you drop a foot or two of rain in hilly or mountain terrain the flooding problem is much worse.  Florence took advantage of a very wet summer in the Mid Atlantic; the ground was already saturated from near record to record rainfall. Florence crawling along dumped copious amounts of rain quite dangerous because of the rain type that falls.  There are two types of rain, "cold rain" and "warm rain" . The type of rain we in the Northeast are acquainted with is cold rain.  Cold rain is non tropical. It starts high in the cloud as snowflakes; the snow melts into raindrops on the way down. Warm rain is tropical in nature. It starts as small droplets. As they descend they collide with other droplets that are moving slower. As a result of the collision the droplets can split or merge. The ones that split fall and hit other droplets. The ones that merge grow into very small drops and continue downward. a little faster. The small drops crash into other drops splitting or merging and falling even faster, This process continues all the way to the ground. This is why tropical rainfall has large rain rates and so much collects is a very short time.  Warm rain, is a very dangerous affair, and has lead to many deaths.    

How much force does wind have anyway?:

There are groups that have been working on all these aspects. A team from Purdue University: Dan Chavas, Kevin Reed, and John Knaff came up with an approach that uses Integrated Kinetic Energy. There is a lot of high level math involved. But the kinetic energy of an object depends on the square of its speed, and is directly proportional to the mass of the object.   When we're outside we can feel the kinetic energy force of the wind.  On a gusty day we can sometimes hear the house respond to that force. Let's say a 50 mph wind gust hits our house inside we can surely hear the air collide with the house.  How much force is being slammed into the house? The answer to that is easier to show using math. But I will forgo that and try to give you and understanding just how much power wind has. 

The mass of an object is its density multiplied by the volume. After doing the math (trust me I did and this is right) Moisture laden air has a density of close to 1 kilogram per cubic meter, and 50 mph is about 22 meters per second.  After doing more math, we find that a standard 2-liter coke (soda for you Yankees :) )  bottle filled with 50 mph storm wind, has about half a joule of kinetic energy (A joule is amount of force required to move an object by one Newton force that moves the object one meter). That much force expended would feel like someone poked you in the arm.  If we filled a small car with that 50 mph storm wind we would end up with about 700 joules of wind energy.  Now imagine all of that kinetic energy slamming into your house over and over for a hour then four hours.....Now take into account all the houses in your town or city they are also getting hit with that much wind energy.  One thing to remember, is we're only talking 50mph wind force. That is far from hurricane force. As winds increase the force of the wind grows exponentially. That should give you a sense of the power a hurricane has.  This is why the larger the hurricane is the more dangerous it is. This is also why a larger category 1 storm or a category 1 storm with a lower pressure pushes a greater amount water.   A large category 1 hurricane can have a lot more destructive potential than a small category 4 hurricane.   It is all of this that the Saffir Simpson Wind Scale doesn't convey.


A multi faceted rating system:

When issuing tropical advisories and warnings to the general public, the conversation needs to be about impact and not intensity.  I would like to see the Saffir Simpson Wind Scale completely replaced. The reason for this, is that I think air pressure is a better indication of a hurricanes potential than peak wind speed. The difference between the central pressure and the pressure outside of that is known as "Central pressure deficit."  But because of the public's familiarity with the Saffir Simpson category system replacing it is impractical.  When the public hears a category number they instantly know what that means. So any updated rating system has to start with the Saffir Simpson Wind Scale.  Any rating system must take intensity, duration, and size of a storm into account.  It is the only way to know the true damage potential.    

No two tropical cyclones are the same. The aspects across a tropical cyclone are different and some are worse than others.  Each of these aspects can cause different outcomes at landfall. We need a scale that accounts for the size, intensity, and pressure of a tropical cyclone.  Besides a wind rating from 1-5, we need a system that has a 1-5 rating for Surge, Pressure, size and rainfall potential.  These impact scales would be flexible as the storms move inland over different types of terrain.   The surge scale should take into account the characteristics of that specific coastline. The surge scale should also take into account how far the surge is expected to travel inland.  Rainfall could also be identified. A hurricane could have a rainfall category of 2 at landfall. But has the system weakened and merged with frontal systems  or stalled over an area the category could be raised to 4. Something like that would have been useful when Irene and Lee drowned parts of Pennsylvania, New York State, and New England  in 2011.   A rating system 1-5 for central pressure would be a far better indication of a storms destructive potential.  The size of a storm would also have to be integrated into the scale either with a 1-5 category type deal or another way to figure it into the scale.

 
Well that's about it. I do hope I was able to explain why the Saffir Simpson Wind Scale must be upgraded to something that shows the true damage potential of a Tropical Cyclone.