
Erika is no more. She was a
strange little fighter. I'm still going
over all the data, trying to learn why she did what she did, and trying to find
the clues I missed.
First can she bounce back?
I think that is highly unlikely. While Sea Surface Temperatures (SST) in
the Gulf of Mexico (GOM) are very warm upper 80's, wind shear is high enough
that it will rip anything that tries to form, into shreds.
Erika formed on Aug. 24, 2015, as it was almost immediately
classified as a tropical storm. Erika maintained tropical storm status for just
about her entire life cycle. It reached peak intensity with winds of 50 mph on
multiple occasions. But it remained a fairly weak tropical storm.
While Danny had displaced a lot of the dry air in Erika's path,
she still had to fight it. Wind shear
was also something that she had to deal with. Erika encountered quite a bit of
wind shear from the start, which was one factor in precluding significant
strengthening of the system. The wind shear pushed her convection
(thunderstorms) on the eastern side of the storm. The wind shear was a constant
issue with her structure. She just couldn't
find a balance between the cyclonic forces near the surface, with the
anticyclonic forces in the upper levels. Without being able to handle air flow ,
she had issues with maintaining a moist environment.
Her structure issues became even more apparent. As Her low level center was not aligned
with her mid level center and upper level circulation. She took the worst path a tropical cyclone can
take.. Into the Caribbean and the rugged terrain of the island of Hispaniola,
then moving over eastern Cuba. She
struggled for days with land interaction, wind shear and dry air.
When I make a tropical forecast, or any forecast really....I look
at the current data, pattern, and setup, as well as model data. I also spend a
lot of time looking at past patterns and setups....In hindsight, I might have placed
too much emphases on past patterns and setups, when forecasting Erika.
I knew, She needed to stay north of Puerto Rico and Hispaniola.
When I looked at the pattern and setup, The trough and ridge setup in the mid
and upper levels supported this. There was a path that kept her north of the
Islands and heading into Southern Florida. When I looked at the setup, I knew I
had seen that before. I will touch on that later.
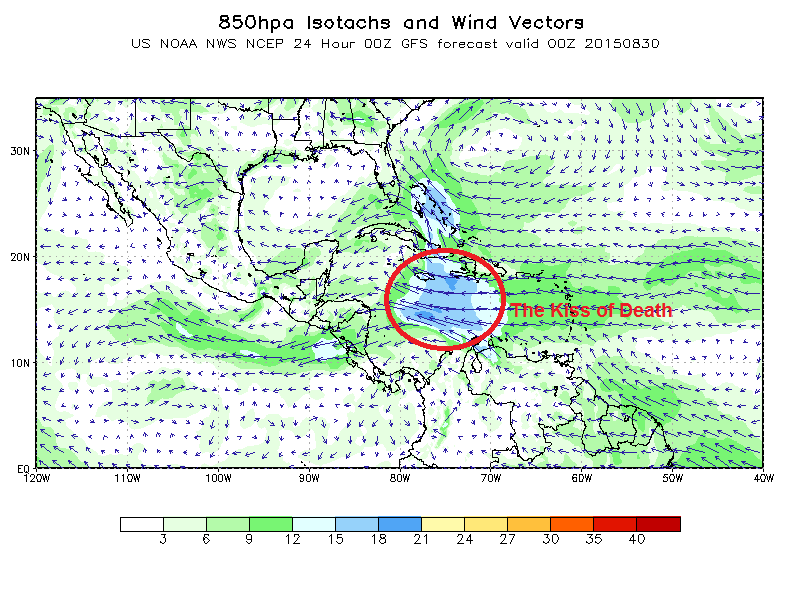
The main lesson I've learned from dealing with Erika. is to not
discount the importance of low level flow.
The low level easterly flow was the main reason for her demise.....
Once her center shifted south of Puerto
Rico; she was on a path of no return. Not only did it place Hispaniola in her
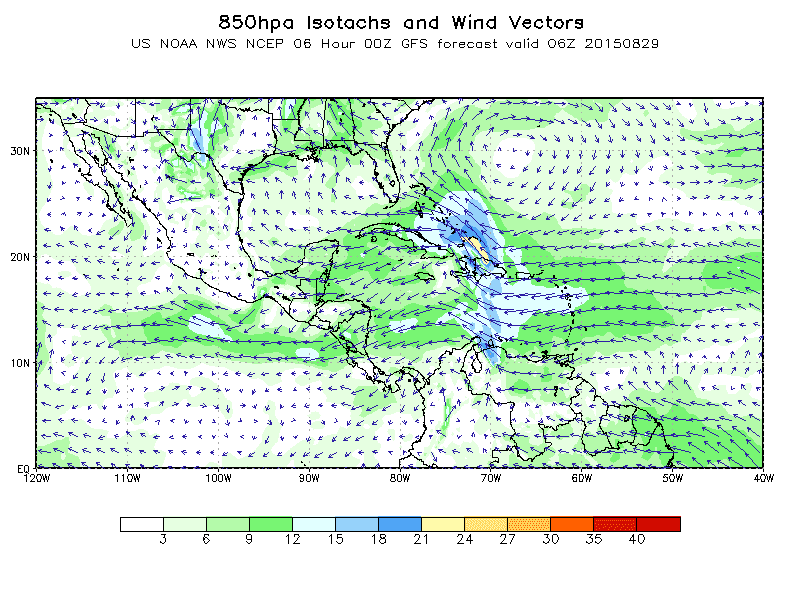
path; it also put her into the area of strong easterly wind shear. Here are a
few 850 mb (5000 feet) level wind profiles.
The strong low level winds disrupted air flow, and prevented a lot of
rising air (Convergence). This area was
a death sentence. As I stated before, it causes issues with retaining heat and
moisture due to a lack of balance between cyclonic convergence near the surface
and anticyclonic divergence aloft.


We also had an area over Cuba into the GOM, that was taking dry
air forcing that into Erika's circulation flow. Once she jogged south those
20-30 miles, she moved into forces that were well beyond her ability to handle.
When Hurricane Hunters couldn't find a closed center of
circulation. The National Hurricane Center declared Erika dissipated back to a
tropical wave near the north coast of Cuba at 9:30 a.m. EDT, on August 29th.
About that past pattern I referred to.
I've plotted the path I thought she would take as well as plot the
track she took from the 24th until she dissipated.


I'm not sure , how many of you have heard of the 1935 Labor Day
Hurricane.
This hurricane formed from a slow moving weak disturbance east of
the Bahamas around the 27th/28th of August, 1935. a couple of days later the U.S. Weather
Bureau (forerunner of the National Weather Service (NWS)) issued an advisory
about a very small but very strong tropical system, that was east of Long
Island, Bahamas. On September 1st the
storm became a hurricane. The hurricane
reached a pressure of 892 mb on September 2nd.
To make matters worse the hurricane wasn't where the Weather Bureau
thought it was. (No satellites back then).
Less than 24 hours before, the storm had winds of 75 mph. Those
winds had nearly doubled by the morning of the 2nd, due to the very warm waters
between the Bahamas and the Florida Keys. The Labor Day hurricane make landfall later
that night as a Category 5, with winds of around 200 mph. The storm killed
hundreds.


Here is an old chart the shows the setup of on September 2nd 1935.
If you compare it to a chart from a couple of days ago...you can see the setup
and pattern looked eerily similar. Both
the Great Labor Day Hurricane and Erika were very small compact storms, and the
SST's for the end of August into September, 1935 north of the Caribbean and
East of the Bahamas. The same area that has very warm SST's this year.
Based on the track I thought Erika would take, and the almost similar
pattern in 1935. I felt South Florida could be dealing with the type of
Hurricane we haven't seen since Hurricane Andrew. Andrew was also a small
hurricane with a similar setup. Because
of this, I felt it was important to state my fears and what could
happen....while at the same time, trying not to sound to alarmist. ...not an
easy task.
So while I don't think I hyped anything.....I should have paid a
bit more attention to the 850/925 mb wind pattern. lesson learned.


