
Part one of
the winter outlook will be largely based on analysis of Sea Surface Temperatures
(particularly those in the equatorial Pacific), looking at possible analog
years, snow extent across Siberia, and the possibility for high latitude blocking
events and how that ties in with the Southern Hemisphere volcanic eruption in
January of this year.
What is a
seasonal outlook?
A seasonal
outlook isn’t like short range and medium range forecast, trying to accurately
forecast something like an entire winter season is a complicated process. At the
start it looks at how temperature and precipitation are trending, using tools
like satellites, radar, and automated surface observations. Then comparing a
variety of atmospheric and oceanic factors as well as things like are snow
cover and soil wetness; these are teleconnections and other indicators. Using
these can give some insight into possible weather patterns that those factors
could lead to. Then looking at computer output and looking at past years that
had a similar look are taken into consideration. The closer the analogue
pattern is to the current pattern, the more weight it is given. Then this information
is compiled, then apply their experience and applying climatology
for a given area and local geography, to try to come up with a general
long-term weather average, of what is likely to occur over the next three to
four months.
This is only
October based on early analysis, there is time for things to change. So I
expect to see some changes in the pattern, that could alter things enough to
make me adjust what I’m seeing right now.
Okay let’s
start the discussion, on what I think is going to happen.
.
The El
Nino and Southern Oscillation (ENSO):
The ENSO involves
Sea Surface Temperature (SST) anomalies across the
equatorial Pacific. ENSO consist of a
warm phase, a neutral phase, and a cool phase. La Nina is the colder phase,
these various phases typically cycle every three to seven years. These changes
disrupt wind, cloud, and pressure patterns over the Pacific, triggering
temperature and precipitation changes across the planet.
It’s
important to remember that La Nina’s are not all the same. The region can see
different outcomes depending on the placement of the La Nina, as well as if it
is considered weak, moderate, or strong. Also, La Nina isn’t the only factor
when it comes to the wintertime pattern.


La Nina is
still here. So, we can expect it to be a major driver in this upcoming winter’s
temperature and precipitation pattern. La Nina’s on average tend to be snowier
than average across northern New York State and northern New England. Weak to
moderate La Nina’s tend to be snowier over a large part of the Northeast. While
strong La Nina’s tend to be much less snowy over southern New England into the
Middle Atlantic. The La Nina should stay weak to moderate for this winter.


Looking at SST
anomalies, we can see the La Nina stands out clearly in the equatorial eastern
and central Pacific. Chart of the ocean
analysis shows those cold ocean anomalies in the tropical Pacific spans almost
the entire length of the tropical Pacific. Looking more closely at the latest
analysis of the ENSO regions below, you can see the strongest cold anomalies
returning in the eastern region. Overall, La Nina looks in a healthy
state. The SST chart also shows the warm
anomalies in the northern Pacific and northern Atlantic.
This seasons
La Nina will be the triple dip La Nina.
This is only the fourth time we’ve seen a triple La Nina since records
have been kept, the other winters that were the third in a row was 1955 – 1956,
the next one was 1975 -1976, the other was 2000 -2001. Here is a timeline of La
Nina events from 1900 to 2022.
Last winter
there were several winter storms during January and February. There were also a
couple of big coastal snowstorms. Those of Y’all who were in the right place ,
got a lot of snow out of these coastal storms, while others didn’t see much if
anything at all. But the result was that many cities in the I-95 corridor ended
up with average to above average snowfall.
IRI ENSO
model predictions of ENSO, show that this seasons La Nina should extend at
least through the heart of winter 2022 – 2023.

A large
majority of the models in the plume predict SSTs to remain below-normal at the
level of a La Nina until at least Dec-Feb 2023.
The latest
equatorial T Penatd anomaly

Shows
subsurface water temperatures in the Pacific are quite cold. This lends a lot
of support to the staying power of our current La Nina conditions.

On the
latest SOI analysis below, we can see persistent positive values with a strong
recent burst. Such data further supports stronger trade winds and ocean cooling
in the ENSO regions, sustaining and further cooling the La Nina towards Winter
2022/2023.

As is
usually the case in a La Nina, the Southern Ridge will be an influence this
winter. For now, I don’t think the southeast ridge will be as influential as it
was last winter.
Analogue
winters:
1955 -1956, 1975-1976, 2000-2001

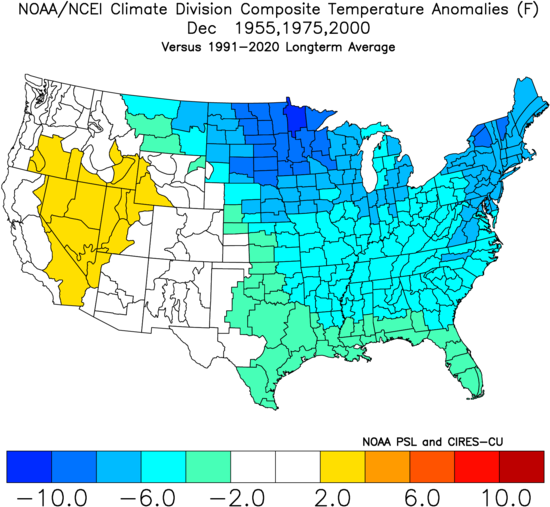


This shows that 3rd year La Nina’s tend to be colder than average across the Northeast and Middle Atlantic, with northern New York State and northern New England being 2°F to 3°F below average. As far as the precipitation anomalies Maryland, Delaware, southwestern Pennsylvania, and southern New Jersey tend to see slightly below average wintertime precipitation, with the rest of the region seeing average to slightly above average wintertime precipitation.
Looking at
the analogs for the individual months, third year La Ninas, tend to see winter
start early, with both December and January quite cold, then for February and
March temperatures warm a bit, so winter 2022 -2023 could end up front loaded.
When we look
at years that saw similar Sea Surface Temperature patterns, we’re left with 2005,2013, 2014, 2020, and 2021.
Here are
comparisons of our current SST anomalies to those five years.


For now, the analogue winters I will use are
1975 -1976,
1985-1986, 2000-2001, 2005,2013, 2014, 2020, and 2021


There is a correlation between warm Octobers and October tropical activity and colder winters here in the Northeast and northern Middle Atlantic. It remains to be seen if October ends up overall warmer than average; or if we a couple of tropical cyclones come close or make landfall on the U.S. But if we do, it will increase the odds of a cold winter here in the Northeast.
Siberian
snow cover:

Now that we’re
in Mid-October, we can try to get a feel for what’s going in with Siberian snow
cover. A few weeks ago, snow cover in Siberia was quickly expanding. In fact,
it was the fastest advance in over 12 years. But since then, snow cover advance
as slowed down a lot. So currently
Siberian snow cover is at a moderate level when compared to other years. The
pattern over that part of the world is such, that I don’t expect to see any big
changes in snow extent over the 7-10 days. After that conditions should become
more conductive for more in the way of snow, so we should see snow cover expand.
I expect by
the end of October snow extent will be above average. The question is will it
be slightly above average or well above average. Given the current pause in
snowfall over Siberia, it will be an uphill climb to reach well above average.
But the pattern that looks to setup says it could be possible. We will see.
A few teleconnection
thoughts:
The
Madden Julian Oscillation (MJO):
The MJO is
currently in phase six. Phase six on average tends to favor ridging over
western North America and troughing over eastern North America. This could keep
October on the coolish side. A cooler overall October would mean a cold winter
would be less likely, but that would only be one factor.
The Atlantic
Oscillation (AO):
Right now,
the AO is positive. Then it looks to become more neutral for much of the rest
of October. I think the AO will become overall negative during the first week
of November
The North
Atlantic Oscillation (NAO):
While the AO
is going to be neutral for a week or two. The NAO looks to be negative during
the same time. The NAO will likely stay slightly negative for at least the first
part of November.
The Hunga
Tonga Volcanic eruption:
The eruption
in the southern Pacific, Introduced a lot of water vapor and debris into the
stratosphere in the Southern Hemisphere. The eruption resulted in a large
stratospheric cooling event in the Southern Hemisphere. There is a correlation
between what happened in the Southern Hemisphere earlier this year, and high
latitude blocking over Greenland and a predominantly negative NAO pattern for
this winter.

Years that
had similar Southern Hemisphere cooling were 1988,1990,2002,2004, 2009,
2010,2016, 2019,2022


Looking at
the 500mb geopotential height composite anomaly those analogue years, based on 1991 2020 climatology for the winter months of December through
February. It clearly shows that idea of an overall negative NAO with higher
latitude blocking over Greenland, is a good bet for this winter.
High
latitude blocking does tend to increase the odds of cold air outbreak in the
Central and Eastern U.S.
As far as
the Polar Vortex, I don’t think it will be super weak like we’ve seen in
winters like 2020-2021. But we still should end up with a few times the polar
Vortex breaks down enough to allow some of that arctic air to move into the
Northeast.
Great
Lakes water temperature:

Temperatures over the last few weeks have been generally below average. As a result, the water temperatures across the Great Lakes are slightly cooler than average for this time of year. The Lakes will cool down slowly as we head into mid-November. Lake effect snow should be average to above average this winter.


Images from
the PRISM Climate Group at Oregon State University
Bottom line,
and putting it all together:
On average
for the Northeast and northern Middle Atlantic region, La Nina winters tend to
be rather chilly, with snow typically ending up a story of the haves and have
nots.
This winter
looks Likely to have an active northern jet stream and a persistent ridge in
the Southeast US. I
Because of
all the stratospheric cooling earlier this from the Hunga Tonga volcanic
eruption , I think there should be a more predominate tendency for the NAO to
stay generally negative during winter 2022-2023. Which will lead to a greater
chance for blocking over Greenland and increasing the odds for at least some cold
air outbreaks. That along with the tendency for triple dip La Nina to be colder
than average. I think this winter will be at least somewhat overall colder than
the last couple of winters.
Temperatures:
Based on the
analogue package I’m currently using, winter 2022-2023 will likely start early.
The pattern I see developing will likely be somewhat bookend like, with a lot
of cold on the front end, then February could be warmish, before we see a cool
down before April.
December into
Mid-January is likely to be cold.
The end of
January and into Mid-February could be inundated with some milder temperatures.
So, there is a chance during that time temperatures will be overall above
average for that time of year.
Then March
will likely turn chilly again.
Snowfall:
Based on the
pattern that looks to setup, interior parts of the region look to be more in
the way of snowy, while parts of the Middle Atlantic and southern New England
will see less in the way of snow. But all in all I see winter 2022-2023 being more
in the way of what some expect winter to look like in our region.
Western and
Central Pennsylvania, western into central New York State and into the
Adirondacks should end up with snowfall that is 120% to
130 % of the seasonal average.
Northern into Central New England slightly above average with total amounts of 105%
to 115% of average.
For eastern
New York State and the Hudson Valley, southern New England, New Jersey, eastern
Maryland, Delaware, and New Jersey. 85% to 100%
As for the
major coastal cities, New York City and
Boston snowfall looks to be right around average. For cities like Washington
D.C., Philadelphia, Baltimore snowfall will most likely be slightly below
average to below average.
Snowfall in
New England into Maryland, Delaware, and New Jersey, especially for the I-95 Corridor,
a lot will depend on the storm track evolving from any Coastal storms that do
develop.
Well, that’s it for Part one, as we get closer to the official start of winter. I will have a better handle on how things look to trend, as I release part 2 and maybe part three these will try to narrow things down more and provide more detail.
.
No comments:
Post a Comment
Thank you for taking the time to comment, I will answer as soon as I can.