
1) The Thunderstorm Life Cycle
2) Types of thunderstorms
3) Visual aspects of thunderstorms (structure)
4) Wall clouds and other lowering cloud formations.
5) Non-tornadic severe weather
6) The Tornado
How to read and interpret weather radar.
The weather radar you see on WTEN is called Doppler radar. Doppler radar emits beams (Pulses) of microwave energy from a transmitter into the atmosphere. When these beams collide with objects in the atmosphere such as: raindrops, hail stones, snowflakes, birds, or even the ground, the energy is sent back to the radar. Once the receiver get this data it displays it in different ways which will be discussed later. Modern Doppler radar is called WSR-88D the WSR stands for Weather Surveillance Radar. There are 155-159 high-resolution Doppler weather radars operated by the National Weather Service around the United States and other U.S. territories. They are part of a network of Doppler radars called NEXRAD (Next Generation Radar).
.

NEXRAD Doppler Weather Radar. Image credit: NOAA

The NEXRAD system.
What is NEXRAD Radar?
NEXRAD was established in 1988 to replace the less capable and reliable WSR-74 system. NEXRAD provides a three-dimensional view of the weather around the radar station. Meteorologist now have the ability of seeing the weather in 3 dimensions, can now better identify severe weather areas, analyze the storm structure vertically and gather upper air wind data. NEXRAD radar has dozens of products, including Base Reflectivity, Base Velocity, Composite Reflectivity, Echo Tops, Total Storm Precipitation.
NEXRAD doppler radar operates in two modes: Clear Air and Precipitation.
Clear Air Mode:
In this mode, the radar is in its most sensitive operation. This mode has the slowest antenna rotation rate; which allows the radar a longer time to sample the atmosphere. This increased sampling rate increases the radar's sensitivity so it can detect smaller objects in the atmosphere than when it's in precipitation mode. In clear air mode, the radar products update every 10 minutes.
Precipitation Mode:
When rain is occurring, the radar does not need to be as sensitive as in clear air mode as rain provides plenty of returning signals. In Precipitation Mode, the radar products update every 6 minutes.
Precipitation intensity can be determined by measuring the strength of the echoes received by the radar antenna. The amount of energy reflected back to the radar is directly proportional to the precipitation intensity. Echo strength is measured in units of DBZ (decibels). In general, DBZ values greater than 15 indicate areas where the precipitation is reaching the ground; DBZ values less than 15 indicates very light precipitation which may be evaporating before it reaches the ground (virga).
Precipitation intensity is displayed beside an radar image as a colored bar chart. The views in Precipitation Mode are available at four radar "tilt" angles, 0.5°, 1.45°, 2.40°, and 3.35° (these tilt angles are slightly higher when the radar is operated in Clear Air Mode). A tilt angle of 0.5° means that the radar's antenna is tilted 0.5° above the horizon. Viewing multiple tilt angles can help one detect precipitation, evaluate storm structure, locate atmospheric boundaries, and determine hail potential.
NEXRAD radar products:
Base Reflectivity
Composite Reflectivity
Base Radial Velocity
Storm Relative Mean Radial Velocity
Echo Tops
Storm Total Precipitation
1 Hour Running Total Precipitation
Base Reflectivity:
Base Reflectivity corresponds to the amount of energy that is being reflected back to the antenna. The images are color coded to indicate the strength what the radar is seeing. A strong reflected signal will be colored differently than a lower one. The amount of reflective signal is a relative indicator of rain or hail intensity. The heavier the precipitation intensity, the stronger the downdraft and the updraft are in the thunderstorm. This gives you a general idea of the intensity of the a thunderstorm and the potential for severe weather. The maximum range of the short range Base Reflectivity product is around 143 miles. If you're using long range Base Reflectivity you can see out to about 286 mi.

In the above Image from Weather underground; you can see the intensity of the precipitation. As mentioned above, precipitation intensity is usually monitored by color. The green/yellow represents light precipitation. The orange/red represents heavy rain, and the purple/white represents extremely heavy rain, but more likely hail.
Here's a table showing how precipitation intensity corresponds with dBZ
15-30 dBZ = Light Precipitation
30-45 dBZ = Moderate Precipitation
45 and higher dBZ = Heavy Precipitation
Composite Reflectivity:
This product is used to reveal the highest reflectivity in all echoes. When compared with Base Reflectivity, the Composite Reflectivity can reveal important storm structure features and intensity trends of storms.
Base Radial Velocity:
Storm-Relative Radial Velocity:
This product is the same as Base Velocity only with the average motion of the storm subtracted out. Storm-Relative Radial Velocity can be useful in finding circulation in a thunderstorm. This product is available for four radar "tilt" angles, 0.5°, 1.45°, 2.40°, and 3.35°.
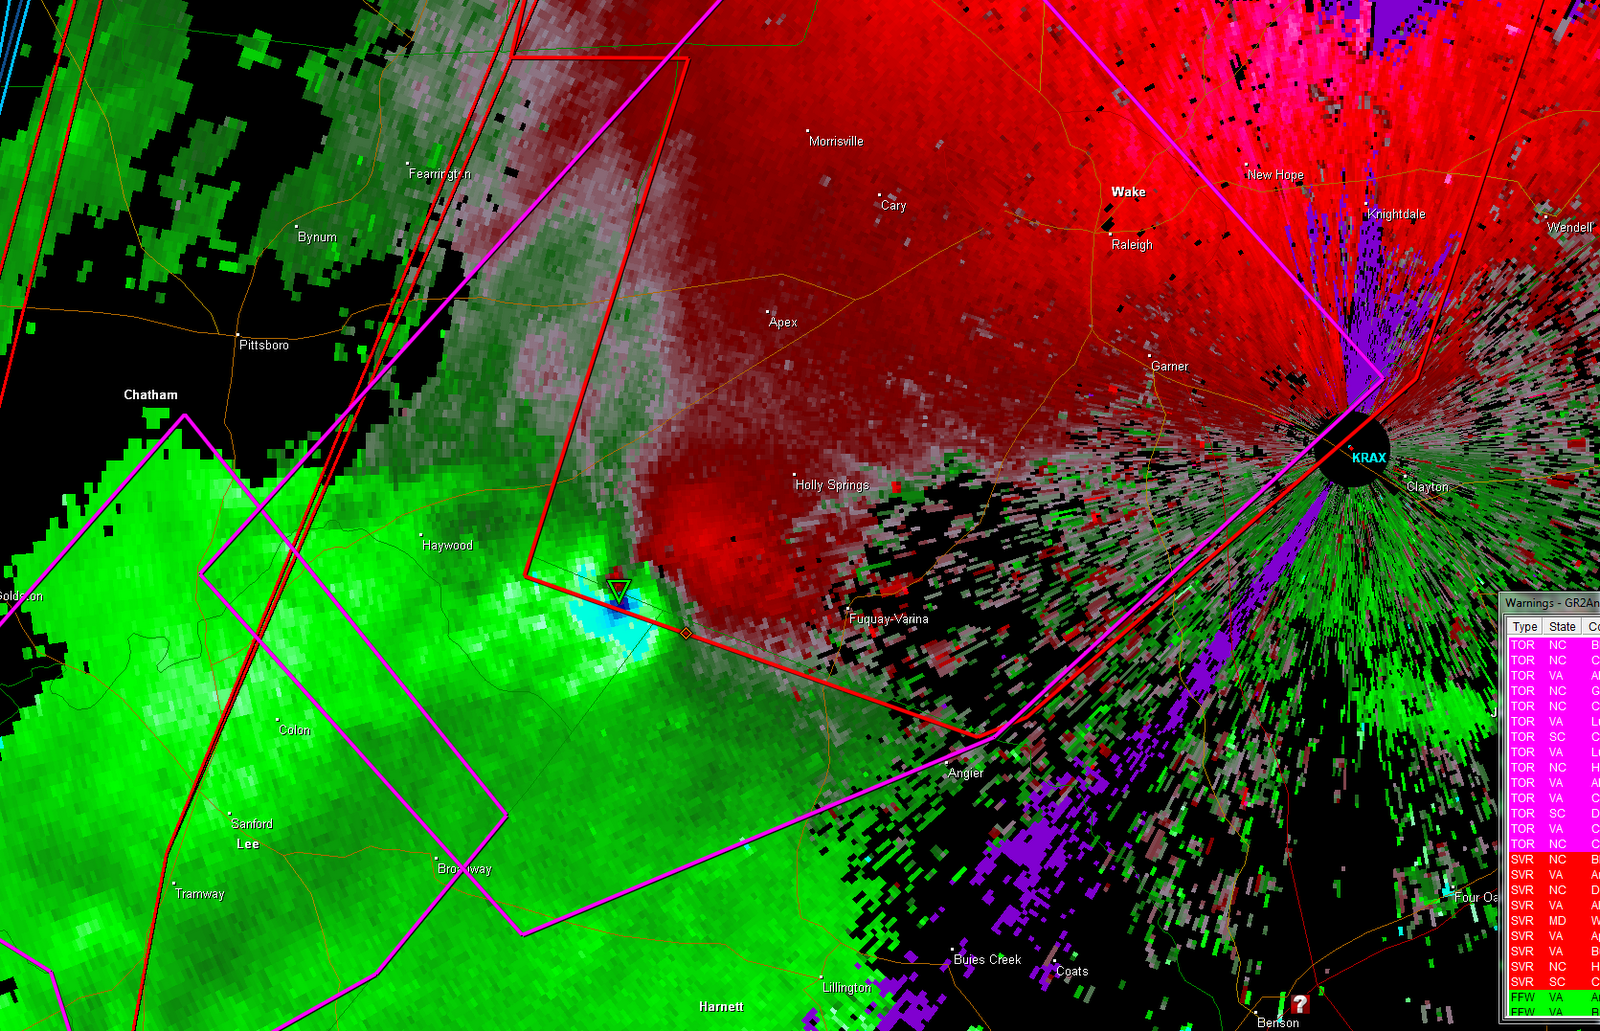
The above Velocity scan shows a tornado heading toward Holly Springs NC. The tornado is located where you see the bright green wrapping around the bright red in the middle of the image.
Echo Tops:
The Echo Tops product shows the height above sea level of the precipitation echoes as it extend up to in the atmosphere. One thing to keep in mind, Echo Tops are not the cloud tops, usually the top of the cloud will be somewhat higher than the top of the precipitation echoes. The lowest detectable tops are those at 5,000 feet, while the highest detectable tops are at heights of 70,000 feet. Echo Top readings are extremely valuable they give information about individual thunderstorms and their potential for producing severe weather. For example, echo tops can help identify areas of strong updrafts. The higher the echo tops, generally speaking, the stronger the updrafts within the thunderstorm.
Storm Total Precipitation:
This product shows the estimated accumulated rainfall, continuously updated, since the last one-hour break in precipitation. This product is used to locate flood potential over urban or rural areas, estimate total basin runoff and provide rainfall accumulations for the duration of the event.
1 Hour Running Total Precipitation:
This product show an estimate of one-hour precipitation accumulation. it is very useful for evaluating rainfall intensities for the possibility of flash floods.
I hope you enjoyed this write up. While it won't make you a meteorologist; It should give you an idea of what the WTEN weather team have to do before they relay weather information to you. I hope it gives you a greater understanding of the wonderful world of weather that surrounds us every day.
Rebecca Ladd.
This was very interesting. I can now look at a radar image on my computer and have some idea what I'm looking at.
ReplyDeleteGlad you enjoyed it! Great write-up by Rebecca! -AG
ReplyDeleteA nice enjoyable read.
ReplyDeleteNice, I look forward to the next installment.
ReplyDeleteThanks Rebecca is smiling!
ReplyDeleteVery good stuff. Thanks, now I think I understand reading radar better.
ReplyDeleteYou're welcome, The purpose of this blog is to try to unravel the intricacies of meteorology. And in so doing give everyone a better understanding and appreciation of the weather going on around us all the time........Thanks for taking the time to read some of the stuff in this blog.
ReplyDelete