
If you
haven’t read part one of this outlook you can find it here.
There is no
doubt that long-range forecasting is difficult, but meteorological spring is a
few weeks behind us and astronomical spring comes Sunday at 11:33 AM, after
doing a lot of research involving model data, teleconnection and other
atmospheric signals as well as looking at some analog years, here's how the end
of March into June should generally go.
Looking
back at the temperature and precipitation anomalies from winter 2021-2022
December 2021 temperature departure

December 2021 percent
of normal precipitation

January
2022 temperature departure

January 2022
percent of normal precipitation

February
2022 temperature departure

February
2022 percent of normal precipitation


The teleconnections:
The El Nino
Southern Osculation (ENSO):
ENSO has a
major influence on the atmospheric patterns and the complex exchange between
the ocean and the atmosphere. An El Nino phase is characterized by warmer-than-average
sea surface temperatures over the equatorial Pacific
Ocean and La Nina is characterized by cooler-than-average sea surface
temperatures over the equatorial Pacific Ocean. A neutral ENSO means conditions
are considered average, with no influence from El Nino or La Nina. We are
currently in a 2nd year of La Nina.
La Nina
conditions continue in the equatorial part of the
Pacific Ocean which then weakened from their peak to near neutral status during
the spring and summer of this year.
Below-average
sea surface temperatures (SSTs) strengthened during February 2022 across the
central and east-central tropical Pacific
The weekly
ENSO region departures updated March 14th.
Nino 1+2 -0.5°C
Nino 3 -0.8°C
Nino 3.4 -1.0°C
Nino 4 -0.7°C

Earlier
this winter the La Nina was stronger in the eastern equatorial Pacific, but in
spite of the models saying back in early winter that La Nina would be neutral
by April into May. The La Nina while past its peak it has strengthened in the
central and western equatorial Pacific while weakening in the eastern tropical
Pacific, giving the look of a La Nina Modoki (central based). The trade winds remain stronger than average
in the western Pacific. As long as these trades remain strong it will keep
delaying the La Nina retreat. Negative
Below-average
temperatures have expanded near the surface and at depth near 150°W
The
critical ENSO region is 3.4. But looking at the ENSO region data, we can
clearly see the La Nina has shifted west into the central Pacific.

Looking at the Subsurface data from the Global Tropical Moored Bouy Array Office we can clearly see the water is cooling.

In part 1
of this outlook, I touched on how we could see La Nina extend into winter or
even beyond. The Australian Models now indicate a return to neutral ENSO
levels—neither La Nina nor El Nino late in the late in the autumn. The IRI/CPC
plume has changed from what it was showing back in February, and lengthening
the La Nina. When we look at the CFSv2
Nino 3.4 forecast, we can see it supports the idea of La Nina lasting through
this Summer and perhaps into 2023. The European Model is also showing the La
Nina lasting longer than it originally thought. Even if La Nina weakens, it
will continue to influence global weather and climate. This of course would
have a big impact on the 2022 Atlantic hurricane season.
We have a
negative Pacific Decadal Oscillation (PDO) off the Alaskan Coast in the
Northwest Pacific
The PDO pattern favors colder temperatures across
northwestern North America and milder temperatures across southeastern North
America.
The Arctic
Oscillation (AO) is currently positive and is predicted to remain neutral to
positive through late-March with mixed to mostly negative height anomalies
across the Arctic especially the North Atlantic side of the Arctic and mixed height
anomalies across the mid-latitudes. The North Atlantic Oscillation (NAO) is
also positive and is predicted to remain positive as height anomalies are
predicted to remain negative across Greenland the next two weeks.
The Polar Vortex (PV):
On the
picture under we now have the seasonal common zonal wind pace for the Polar
Vortex at 10mb degree. The black line is the long-term common, and the blue
line is the polar vortex power within the 2021/22cold season. We are able to
see that for many of the chilly season, the polar vortex was stronger than
regular.
When we
look at the PV is already somewhat disrupted.
We can see there is polar stratospheric warming going on spread across
the North American side of the Arctic with ridging centered near Alaska.
When we
look at the Northern Hemisphere 500 mb from Tropical Tidbits,
In the
first image we can see two areas exhibiting a strong Rossby wave improvement,
releasing lots of power up into the stratosphere.

In the
second image, we can see two area of chilly air separated by two strong ridges.
One of the cores of colder air is over Siberia the other is over eastern North
America. These colder pockets will
lengthen as we move toward into April.

This all
shows up the best in the third image that is a 3D construction forecast. The
Polar Vortex is clearly separated on all however the lowest ranges. Cores are
absolutely indifferent and shedding power.

Over the
winter we had several Sudden Stratospheric Warmings that lead to weak PV disruptions,
The current one is more of a classic PV disruption. So, this will likely be the
largest and last PV disruption of the year.
This
supports the idea I’ve been talking about on my social media weather pages for a
while. And how we’re not quite done with coolish weather and possible shots of
winter weather. This would indicate that there is a good likelihood of high latitude
Greenland blocking that sets up that would help bring in a colder and/or
stormier weather across the Eastern US.
March:
As is typical of
March we’ve seen some wild swings in temperatures. The pattern is hinting at
the idea of a trough setting up over the East for the last week of March, this
will allow for generally below average temperatures to return as we close out
March. March is typically fairly wet, and this March shouldn’t be an exception.
April:
I expect to
see the trough to basically stick around for the first part of March. With the
trough April should start out with cooler than average temperatures. Once we approach
mid-April, we should see the pattern quickly change to a prolong spring with
generally warmer than average temperatures.
It’s not
uncommon to see snow in the end of March into April. With the pattern remaining
active there could be snow chances during that time, this will be especially true
for New York State and northern and central New England; I don’t think New York
State nor New England will see any more major snowstorms, minor accumulating
events of a few inches will be possible. While I can’t rule out higher
elevation snow in Pennsylvania and the Middle Atlantic, I think your snow
chances are fairly low.
As far as rain,
I think this April is going to see generally average to below average rainfall
over a large part of the Northeast and Middle Atlantic.
Here is a
look at the forecasted average 500 mb geopotential heights (dam; contours) and
geopotential height anomalies (m; shading) across the Northern Hemisphere for
April 2022. The forecasts are from the 00Z 14 March 2022 CFS.

May:
Looks to be
generally quite warm, I also see the theme from April continuing with generally
dryer than average conditions setting up across the region.
March, April and May overall:
I expect
this to be a warm overall spring, with temperatures averaging 1 to 2 degrees
above average.
We're
expecting a changeable pattern into mid-April with a couple of “colder” spells,
then we believe the overall pattern turns milder from mid-April on through
spring and we average 1 to 2 degrees warmer than normal.
I think
average spring rainfall across the Northeast and Middle Atlantic is going to generally
be average to slightly below average.
Spring Flood Potential:
We have a lack
of deep snowpack across the region. So, this will severely curtail Spring snow
melt and runoff. As a result, I don’t
see a major flood issue across the Northeast and Mid-Atlantic, due to winter
time conditions.

Drought outlook:
As I said
this Spring looks to see average to slightly below average rainfall.
Drought
conditions have been slow to improve over the last few months in New England. Looking
at the drought monitor map we can see a large part of New England as well as
southeastern and southern Pennsylvania into Maryland, Delaware and New Jersey
are experiencing abnormal dryness and moderate drought conditions. So, I think the drought conditions will slowly
worsen during this Spring; then the drought conditions will become even worse
as we head into the dryer summer months.

Severe Weather:
Spring
generally means that warmer temperatures are returning. But with warmer
temperatures, the severe weather season also returns to the United States. Severe
weather will be slow to ramp up this Spring. but now is the time for you and
your family to prepare for what may be a busier than normal season.
Typically,
during La Nina, the Spring tornado season in the United States tends to be very
active.
Below we
have a very interesting image from NOAA Climate. It shows a frequency of
hailstorms and tornado events during the spring season in the United States,
compared between El Nino and La Nina years.
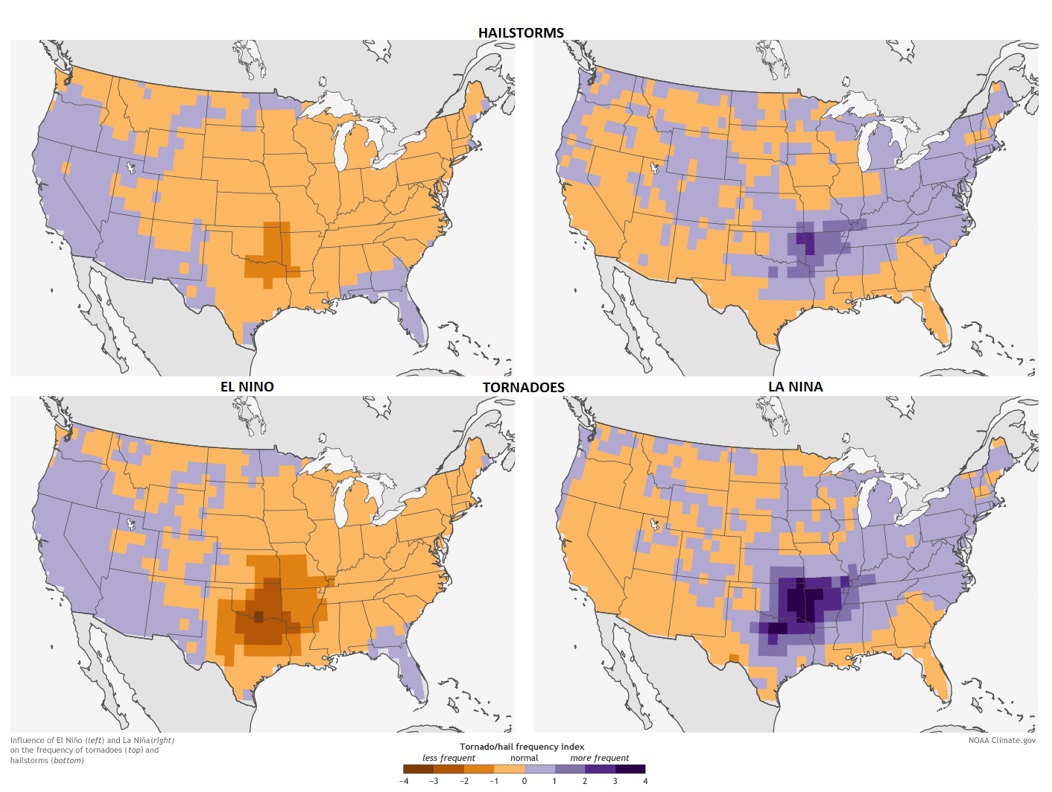
We can see
that in a La Nina spring season, there is a substantially higher frequency of
hailstorms and tornado events compared to an El Nino. The highest frequency is
found in the southern and southeastern parts of the United States.
So, I
expect to see an active severe season here in the Northeast and Middle Atlantic
Region.
Atlantic Hurricane Season:
As I said
above, over the past few weeks, La Nina has grown stronger. Those cooling waters in the equatorial Pacific
will have a direct impact on the Atlantic Hurricane Season.
Hurricanes
need Sea Surface Temperatures (SST) to be more than 80°F for up to 165 feet
below the ocean’s surface, The warmer the water, the warmer the water the more
energy available to fuel the hurricane, and the stronger it becomes. They also need
high relative humidity values from the surface to the mid-levels of the
atmosphere. They also need low wind
shear, wind shear is very disruptive for hurricanes, and tropical storm formation.
La Nina's
most pronounced impact in the Atlantic basin is decreasing the amount of this disruptive
wind shear. Lower wind shear increases
the potential for increased number of hurricanes that develop and allows
stronger hurricanes to form.
As I said,
our current La Nina could very well, persist through September. If this happens
it would only be the third time since 1950 that La Nina was present for three
consecutive hurricane seasons.
When we
look at the Atlantic SSTs, it shows warmer Atlantic Ocean waters, that will
likely continue into summer.
So based on
how this current La Nina is looking to evolve, we will likely see more
hurricanes than average during this upcoming hurricane season. The last two hurricane seasons were very
active. Based on the current setup, my very early call is for 16-24 Atlantic
Tropical Cyclones for 2022.


